The next part of our exploration into Heaps Curves is to analyze the Skiptune corpus after it has been ordered by year of composition and publication. As this is a blog, we are constantly updating and adding to the database between the weekly publications. At this point, we happen to have an even 83,400 number of rows (melodies) in the database. At some point we’ll need to re-run all the Heaps Curve analysis on one database, but for now we are just trying to figure out how best to define a “word” in musical melodies, which doesn’t depend on a few more melodies.
The Heaps analysis of the ordered set of tunes produces a vocabulary of 6,609 words and we are a little short of 5 million notes total. That’s about a 68 percent increase in the size of the vocabulary. Here’s the normal plot of the Heaps curve analysis on the ordered database by year:
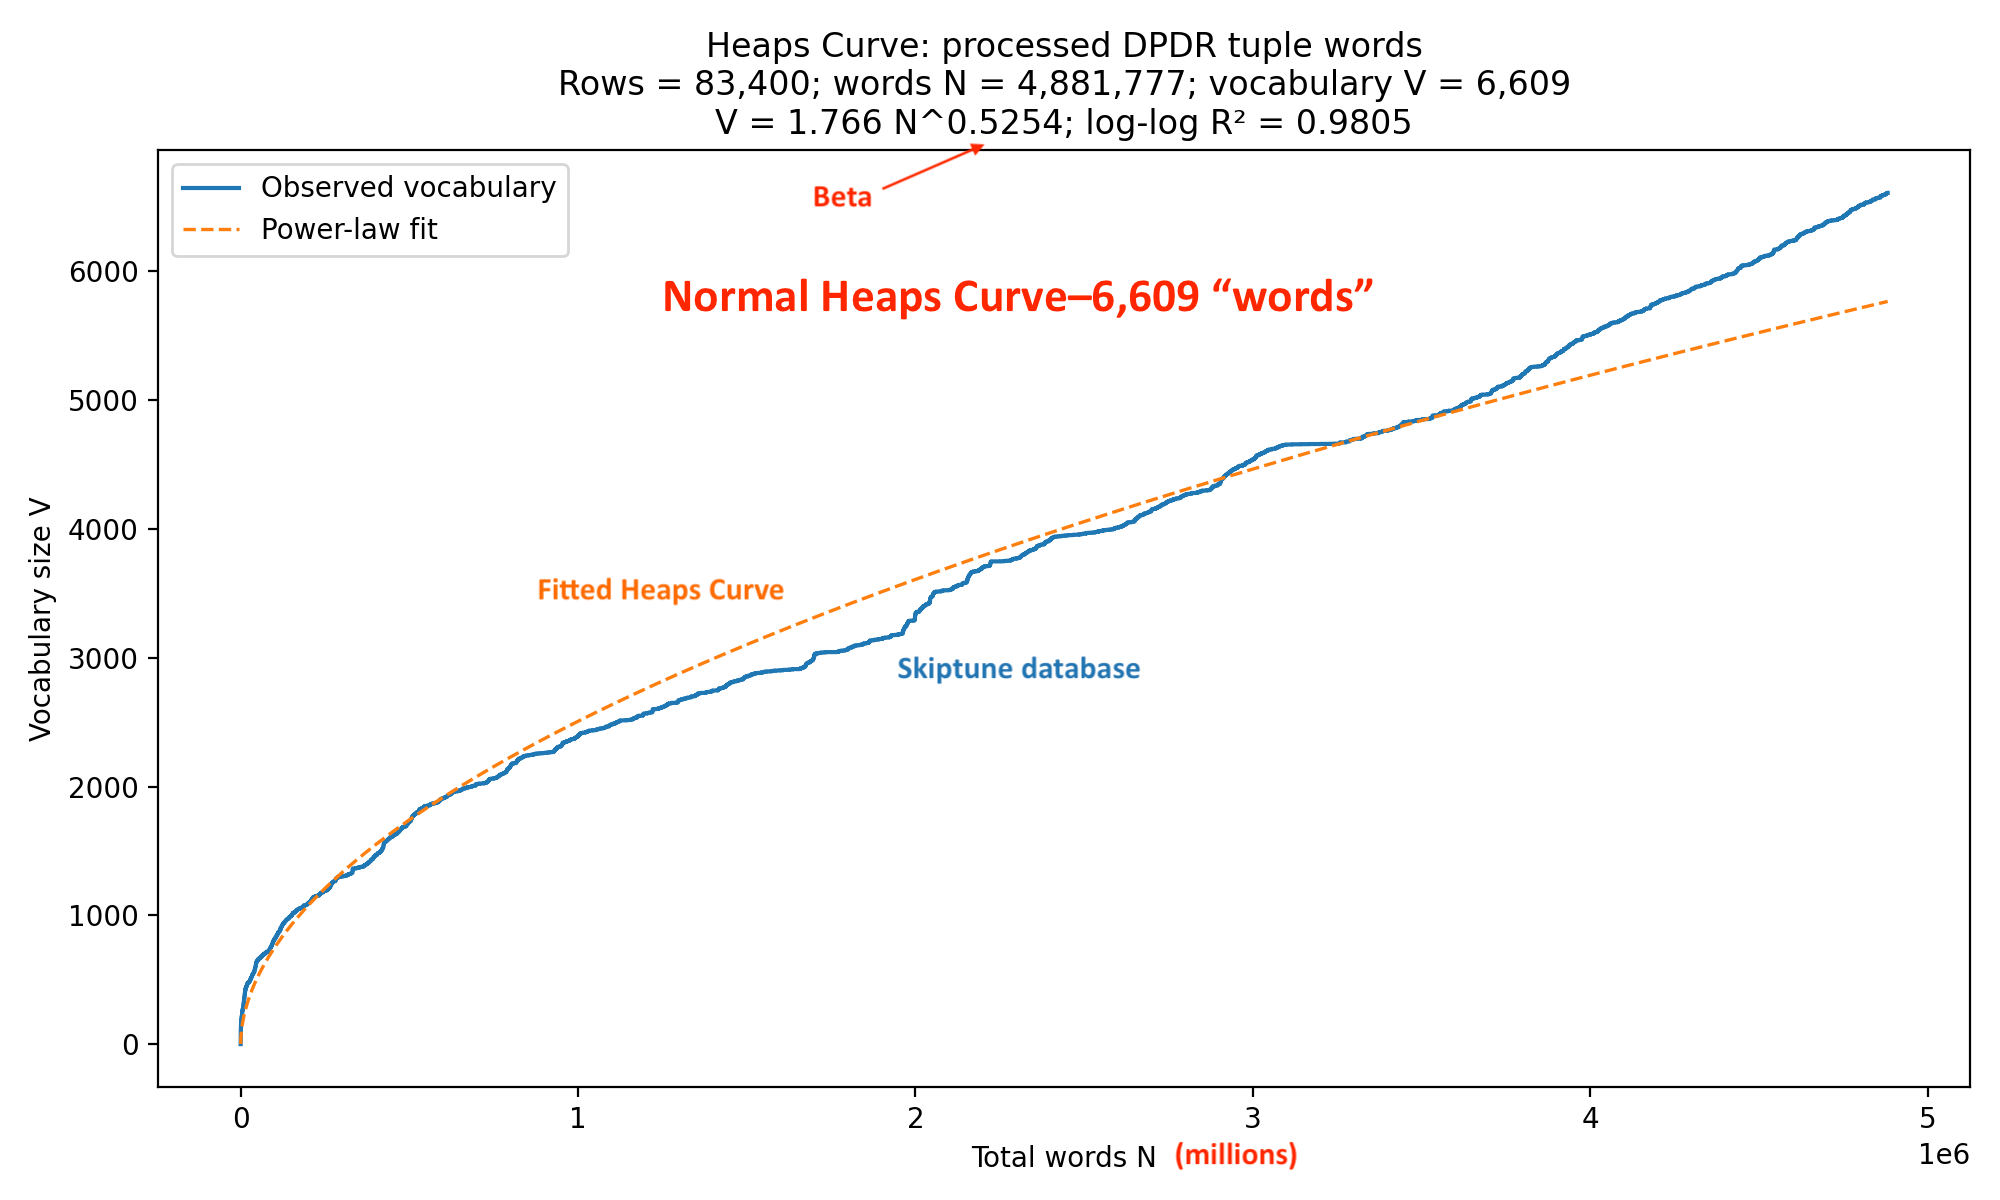
Unlike our earlier pitch-duration word analysis, this curve does not flatten very much near the end. Even after nearly five million words, vocabulary continues to rise noticeably. The final blue section bends upwards relative to the fitted orange curve, which means that recent portions of the database are introducing new words faster than the average power law predicts. Composers are still being creative.
One likely explanation for the creative burst is that twentieth-century and modern music is introducing new vocabulary words faster than previous musical eras. We know that from our analysis on the Measuring Creativity part of this website under “Findings” on the home page. As styles evolve, new motion-rhythm combinations continue appearing even when the underlying pitches and durations are individually familiar.
Most importantly, the beta for this curve is 0.52, substantially higher than the 0.32 when we define a word as a pitch and duration. Pitch differentials and duration ratios offer a much richer vocabulary.
Next, we turn to the log-log plot to flatten things out:
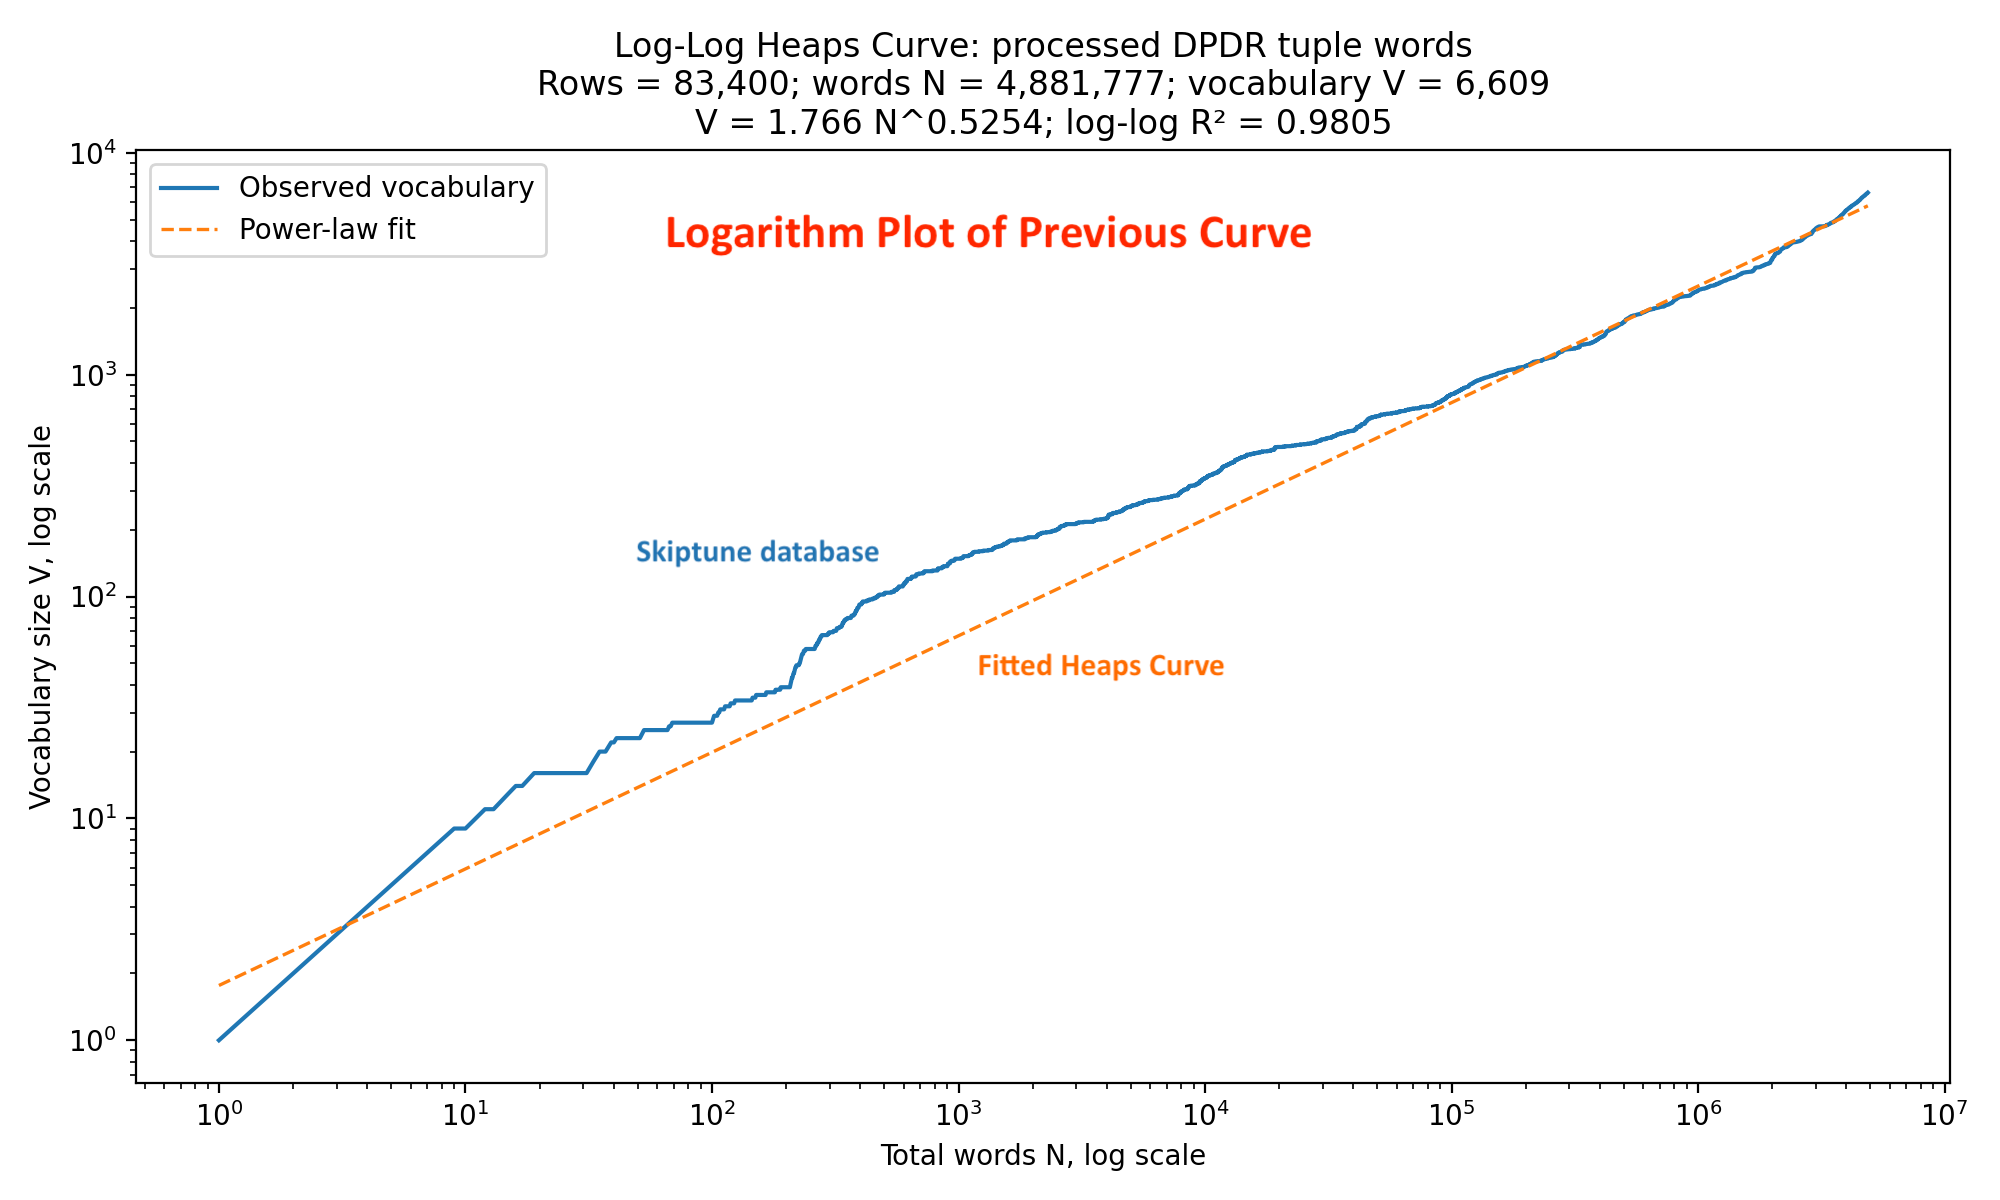
Taking the logarithm of both axes flattens the Heaps fitted orange curve to a straight line, and our blue data to a curve that is remarkably straight after the first thousand words. That means the power-law model is a good description of vocabulary growth over nearly the entire corpus. The fit explains about 98 percent of the variation from the orange line.
The beta of 0.525 is especially noteworthy. Recall that 0.3 indicates a highly repetitive system, while 0.5 indicates a system that continues generating substantial novelty. A beta of 1.0, which we have not seen using the Skiptune data, would mean almost every new word is unique. Thus, the pitch differential followed by a duration ratio falls smack in the middle and highly structured, but shows that new vocabulary words continue to be introduced at a surprisingly high rate well into the latter part of the 20th century.
It’s time to talk about the difference between defining a word as a pitch and duration vs defining it as a pitch differential and a duration ratio. Pitch-duration words describe absolute events, where differential-ratio words describe relationships. Relationships make many more possible combinations because pitch difference varies independently, as does duration ratio, and their combination becomes the vocabulary.
The most likely source of vocabulary inflation is probably not pitch differentials, but rather the duration ratios. That’s because the number of pitch differentials is fixed. Consider the range of a piano, 88 notes, which creates a pitch differential of up to 87. But durations can be changed ad infinitum because one can always add a tied note to any duration to extend it, changing the duration ratio and eventually coming across one that hasn’t been used before. In turn, that means the vocabulary growth is being driven by rhythmic detail rather than melodic detail.
Next week we’ll take a look at shuffling the order of the database over and over again to see how stable and robust our findings are.