On this page we list the most common two-, three-, and four-note patterns found in the database. To discuss this topic efficiently it is necessary to use a bit of jargon. All patterns are referred to in brackets consisting of an interval in MIDI values and a duration ratio. An example of a two-note pattern is [0 1], referring to two notes of the same pitch and same duration, such as a quarter note followed by the same quarter note. That’s because the “zero” in the brackets means there’s no change to the pitch MIDI value. The “one” in the bracket means the duration ratio is 1-to-1, so the duration of the first note is the same as the duration of the second note. The three-note pattern [0 1 0 1] refers, for instance, to three quarter notes of all the same pitch. Likewise, four quarter notes of the same pitch would be expressed as [0 1 0 1 0 1] .
2-Note Patterns (Most Common)
That composers return to familiar patterns of notes is obvious, but the Skiptune database allows us to quantify that observation. Here are the 14 most common 2-note patterns used in the database. This table was updated in January 2026 when the database had 82,000 tunes. The order of these patterns has remained stable for a couple of years of entering data, especially for the top 10. It is unlikely that entering more tunes will change the order of the top most common patterns because the sample size is already quite large and the database increasingly reflects an accurate picture of common patterns.
Table 1. Common 2-Note Patterns
| Pattern | Interval | Frequency (thousands) | Percent of All Patterns | # Tunes with This Pattern (thousands) | Percent of Tunes with This Pattern |
|---|---|---|---|---|---|
| [-2 1] | major 2nd | 487 | 10 | 69 | 84 |
| [2 1] | major 2nd | 421 | 9 | 66 | 81 |
| [0 1] | unity | 313 | 7 | 52 | 64 |
| [-1 1] | minor 2nd | 263 | 6 | 56 | 68 |
| [1 1] | minor 2nd | 247 | 5 | 56 | 68 |
| [-3 1] | minor 3rd | 178 | 4 | 48 | 58 |
| [3 1] | minor 3rd | 132 | 3 | 40 | 49 |
| [-4 1] | major 3rd | 106 | 2 | 36 | 44 |
| [5 1] | fourth | 94 | 2 | 36 | 44 |
| [-2 2] | major 2nd | 89 | 2 | 38 | 47 |
| [2 2] | major 2nd | 88 | 2 | 38 | 46 |
| [4 1] | major 3rd | 79 | 2 | 30 | 36 |
| [rest 1] | N/A | 78 | 2 | 26 | 32 |
| [0 0.5] | unison | 73 | 2 | 29 | 36 |
The pitches and durations shown are examples using a “C” quarter note followed by another “C” quarter note to refer to all patterns where the second note is the same as the first note in pitch and duration. In other words, an “F” sixteenth note followed by an “F” sixteenth note in a tune would also be included as this pattern. Patterns are counted each time they occur within a tune in the “frequency” column. Examine the number of tunes and percent of tunes with a given pattern to understand how often the pattern is used without double counting. Here are some observations about this list:
- It might be counterintuitive that the most common pattern is [-2 1] (the second note is a major second lower then the first note, but of the same duration). We would have thought that the most common pattern would have been [0 1] (two notes of the same pitch and duration), but that pattern turns out to be the third most common.
- The second most common pattern, [2 1], is the mirror of the most common pattern. [2 1] includes all patterns where the second note is two intervals above the first note and with the same duration). Composers of all stripes have expressed a pronounced preference for moving two intervals down or up, perhaps because no matter what key a tune is written in there are more intervals of a major second than intervals of a minor second in a scale, and composers often use runs in tunes.
- 84 percent of all tunes in the database have the most common pattern [-2,1], and 81 percent have the second most common pattern [2,1]. After that, the percent of tunes with any other common pattern drops quickly. The third most common pattern, [0,1], appears in only 64 percent of the tunes.
- The list of most common patterns as measured by frequency does not have to exactly correspond to the list of most common patterns as measured by the percent of tunes they appear in. The “frequency” count is the number of times a pattern appears in the database as a whole, and the “# Tunes” counts how times as they appear in a tune. The final column is a percent of the tunes the patterns are in, eliminating any double counting within a tune.
- The 10th most common pattern is the first that has a duration ratio other than 1. The [-2 2] pattern has a duration ratio of 2, which means the second note is twice as long as the note it follows. Like the most common pattern, has an interval of -2.
- The final pattern, [0,0.5], is the first pattern to include a duration ration less than one.
3-Note Patterns (Most Common)
The database of 82,000 tunes contains 90,562 different three-note patterns, and Table 2 below shows the most common 25 patterns. Together, these 25 patterns only represent an accumulated 24 percent of all the 3-note patterns used. In contrast, the 14 most common 2-note patterns in Table 1 represent an accumulated 58 percent of all 2-note patterns. Table 2 shows by column:
- Column 1. The rank and pattern in standard musical notation.
- Column 2. The pattern as it is stored in the database.
- Column 3. The frequency of the pattern in the database.
- Column 4. The accumulated frequency of the patterns as a percent of all the 3-note patterns in the database.
- Column 5. The frequency of the pattern as a percent of all 3-note patterns in the database. It is these frequencies that are used to calculate the accumulated frequencies in the previous column.
- Column 6. The number of tunes containing the pattern.
- Column 7. The percent of tunes containing the pattern.
Column 2 is included for completeness and can be ignored as it merely demonstrates how efficiently the pattern is stored in the database. For instance, the first pattern is expressed as a “-2 1 -2 1” because it consists of a quarter note followed by another quarter note downward a major second, and finishes with another quarter note again downward a major second. Because the quarter notes all have the same duration, their duration ratios are “1”. This translates quite concisely as “-2 1 -2 1”. As these patterns are already numbers, they can be used with little modification in artificial intelligence models.
These common 3-note patterns are similar in that they are, unsurprisingly, made up of the most common 2-note patterns shown in Table 1. They are also similar in that they all have relatively small intervals, a major third being the greatest. We observe elsewhere that composers tend to move downward in pitch by small intervals more often than they move upward in pitch, and this observation is consistent with the common 3-note patterns in Table 2.
Table 2. Most Common 3-Note Patterns
| Rank | Pattern | Frequency (thousands) | Accum Freq % | Freq % | # Tunes (thousands) | % of Tunes |
|---|---|---|---|---|---|---|
| 1 | -2 1 -2 1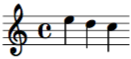 | 101 | 2 | 2.2 | 35 | 42 |
| 2 | -1 1 -2 1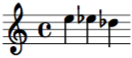 | 89 | 4 | 1.9 | 33 | 40 |
| 3 | -2 1 -1 1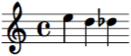 | 87 | 6 | 1.9 | 31 | 38 |
| 4 | 0 1 0 1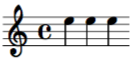 | 86 | 8 | 1.8 | 19 | 23 |
| 5 | 2 1 2 1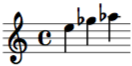 | 80 | 9 | 1.7 | 28 | 34 |
| 6 | 2 1 1 1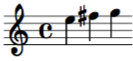 | 72 | 11 | 1.5 | 28 | 34 |
| 7 | 1 1 2 1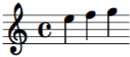 | 69 | 12 | 1.5 | 26 | 32 |
| 8 | -2 1 2 1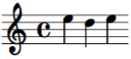 | 63 | 14 | 1.3 | 25 | 30 |
| 9 | 2 1 -2 1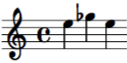 | 62 | 15 | 1.3 | 25 | 30 |
| 10 | -1 1 1 1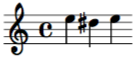 | 57 | 16 | 1.2 | 22 | 27 |
| 11 | 1 1 -1 1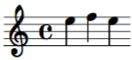 | 36 | 17 | 0.8 | 17 | 20 |
| 12 | -42 1 42 1 | 31 | 18 | 0.7 | 10 | 12 |
| 13 | -2 1 -3 1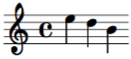 | 28 | 18 | 0.6 | 14 | 17 |
| 14 | 0 1 -2 1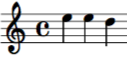 | 25 | 19 | 0.5 | 13 | 16 |
| 15 | -3 1 -4 1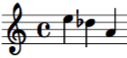 | 23 | 19 | 0.5 | 11 | 13 |
| 16 | -42 0.5 42 1 | 22 | 20 | 0.5 | 10 | 12 |
| 17 | -3 1 3 1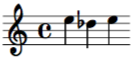 | 22 | 20 | 0.5 | 10 | 12 |
| 18 | 0 1 2 1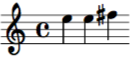 | 22 | 21 | 0.5 | 12 | 15 |
| 19 | -3 1 -2 1 | 21 | 21 | 0.4 | 11 | 14 |
| 20 | 1 1 -3 1 | 21 | 22 | 0.4 | 11 | 14 |
| 21 | 2 1 -4 1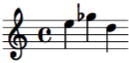 | 21 | 22 | 0.4 | 11 | 14 |
| 22 | -2 1 0 1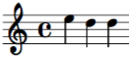 | 19 | 23 | 0.4 | 10 | 13 |
| 23 | 0 1 0 2 | 19 | 23 | 0.4 | 9 | 11 |
| 24 | 2 1 -3 1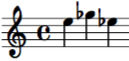 | 19 | 23 | 0.4 | 10 | 12 |
| 25 | 1 1 2 2 | 19 | 24 | 0.4 | 11 | 14 |
For both two- and three-note patterns it is worth exploring how these common patterns are distributed in their full respective set of patterns. In other words, how densely are the two-note and three-note patterns clustered when ordered most frequent to least frequent? The figure below addresses that question by showing the accumulated frequency as a percent of all patterns, both for two- and three-note patterns.
Along the horizontal axis is the number of two- and three-note patterns ordered from most frequent to least frequent. That means the most common patterns are represented on the left portion of the red plotted line. The vertical axis represents the accumulated frequency of each two- and three-note pattern expressed as a percent of all two- and three-note patterns, respectively.
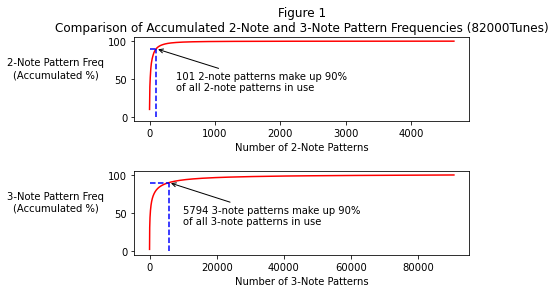
The shape of the curve for each is similar. The primary shape difference is that the two-note pattern curve is slightly “sharper” when it bends to the right, indicating that composers pack more two-note common patterns into their tunes than they do three-note common patterns. The other difference is the scale of the horizontal axis. There are only around 4,700 two-note patterns, but 91,000 three-note patterns.
The above figure shows how far into the list of common two- and three-note patterns we need to go before reaching 90 percent of the most common patterns. The dotted horizontal and vertical lines delineate that point. We find that for two-note patterns we only need 101 patterns to capture 90 percent of the two-note patterns used in the database. However, for three-note patterns, we find we need the most common 5,794 patterns to hit the 90 percent mark.
Thus for two-note patterns, only about two percent of all two-note patterns make up 90 percent of all such patterns used by composers over the centuries. For three-note patterns, a much larger six percent of all such three-note patterns have been relied upon by composers for 90 percent of such patterns in their compositions.
4-Note Patterns (Most Common)
Table 3 below displays the 25 most common 4-note patterns in the database. The first thing that strikes the eye is that all the patterns have notes of the same duration, producing a duration ratio of one. You can see this for yourself by noting that all the notes are quarter notes. Such is not the case with the first two tables for 2- and 3-note patterns, both of which incorporate half notes. We depict the notes as quarter notes as a convention, but they could be eighth notes, sixteenth notes, half notes, or indeed any other single duration value.
A little less obvious is that until the 24th most common pattern, all the intervals are either minor or major seconds. In the 24th most common 4-note pattern, we have for the first time a different interval, a minor third (denoted by the “-3” in the 24th pattern). Also note that the first three most common patterns have no ascending notes, which is also true for the two tables above. That the first two most common 4-note patterns have no ascension in pitch is consistent with our finding (see Figure 1 in the interval distribution page) that there are more minor and major seconds descending in pitch than ascending.
Not so surprisingly, the most common 4-note patterns are made up of the most common 2-note patterns. Observe that the five most common 2-note patterns also consist exclusively of minor and major seconds. The vast majority of the top 25 four-note patterns can be constructed with the top five 2-note patterns, which makes perfect sense as common four-note patterns are made up of common two-note patterns.
Table 3. Most Common 4-Note Patterns
| Rank | Pattern | Frequency (thousands) | Accumul Freq | Freq % | # Tunes (thousands) | % of Tunes |
|---|---|---|---|---|---|---|
| 1 | -1 1 -2 1 -2 1 | 37 | 1 | 0.8 | 17 | 21 |
| 2 | 0 1 0 1 0 1 | 36 | 2 | 0.8 | 8 | 10 |
| 3 | -2 1 -2 1 -1 1 | 36 | 2 | 0.8 | 17 | 20 |
| 4 | -2 1 -1 1 -2 1 | 36 | 3 | 0.8 | 16 | 20 |
| 5 | 2 1 2 1 1 1 | 29 | 4 | 0.6 | 13 | 16 |
| 6 | 2 1 1 1 2 1 | 25 | 4 | 0.5 | 11 | 14 |
| 7 | 1 1 2 1 2 1 | 22 | 5 | 0.5 | 11 | 13 |
| 8 | -2 1 -1 1 1 1 | 18 | 5 | 0.4 | 10 | 12 |
| 9 | -1 1 1 1 2 1 | 18 | 6 | 0.4 | 10 | 12 |
| 10 | 1 1 -1 1 -2 1 | 15 | 6 | 0.3 | 9 | 11 |
| 11 | 2 1 -2 1 -2 1 | 13 | 6 | 0.3 | 8 | 10 |
| 12 | -1 1 -2 1 2 1 | 13 | 6 | 0.3 | 8 | 9 |
| 13 | 2 1 1 1 -1 1 | 13 | 7 | 0.3 | 8 | 9 |
| 14 | -2 1 2 1 -2 1 | 12 | 7 | 0.3 | 6 | 7 |
| 15 | -2 1 -2 1 2 1 | 12 | 7 | 0.3 | 8 | 9 |
| 16 | 2 1 -2 1 2 1 | 12 | 8 | 0.3 | 6 | 7 |
| 17 | -2 1 2 1 2 1 | 11 | 8 | 0.2 | 7 | 8 |
| 18 | 2 1 -2 1 -1 1 | 11 | 8 | 0.2 | 6 | 8 |
| 19 | 1 1 2 1 -2 1 | 11 | 8 | 0.2 | 6 | 8 |
| 20 | 1 1 -1 1 1 1 | 10 | 8 | 0.2 | 5 | 6 |
| 21 | 2 1 2 1 -2 1 | 10 | 9 | 0.2 | 6 | 8 |
| 22 | -2 1 2 1 1 1 | 10 | 9 | 0.2 | 6 | 8 |
| 23 | -1 1 1 1 -1 1 | 9 | 9 | 0.2 | 6 | 6 |
| 24 | 1 1 2 1 -3 1 | 9 | 9 | 0.2 | 5 | 6 |
| 25 | -2 1 -2 1 -2 1 | 8 | 9 | 0.2 | 5 | 6 |
The plot of accumulated percentages of 4-note pattern frequencies (see Figure 2) is similar to those for 2-note and 3-note patterns. Proceeding from Figure 1 to Figure 2 below we see that the knee of the curve continues to become less sharp as we increase the number of note patterns from two to four. In Figure 2, the curve doesn’t hit the black 90 percent line until almost 144,000 4-note patterns have been tabulated out of the total of 492,280 4-note patterns. In other words, nearly a third of all the 4-note patterns are needed to reach the point where 90 percent of all 4-note patterns are used. That’s far larger than the single digit percentages we found for 2- and 3-note patterns.
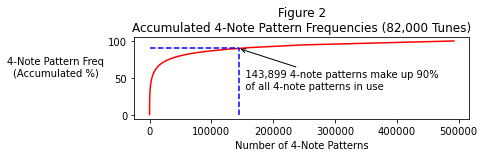
It would seem that diminishing returns set in as we increase the number of notes in a pattern, and that as we increase the number of notes, we need more and more patterns to hit the threshold that covers 90 percent of the frequency of that set of patterns. That means we see more variety in the patterns being used by composers for many-note patterns versus few-note patterns.