On the introductory page for the use of metrics to describe melodies, we walked through a comparison of two variations on a tune to demonstrate how our metrics work. Here, we explore more tunes using the metrics but without the detail of examining every metric. Ideally, we would like to find a threshold around which we could say a tune is essentially the same tune with a small variation. Variations are continuous and there is no such bright line, but that doesn’t mean we can’t explore the possibility.
Example 1.
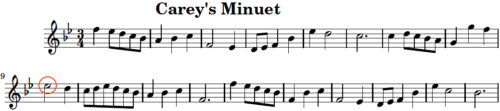
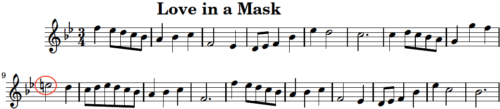
Our first set of examples is two tunes that have completely different names but in fact differ by only one note. They are Carey’s Minuet and Love in a Mask, both from the second volume of John Walsh’s Compleat Country Dancing Master, published around 1740. The two tunes are identical except for the E and E-flat encircled in red on the second line of each tune. Table 1 shows only those metrics that are different for the two tunes.
Table 1 — Carey’s Minuet versus Love in a Mask
| Metric # | Metric Name | Raw Metric, Carey | Normalized, Carey | Raw Metric, Mask | Normalized, Mask | Difference |
|---|---|---|---|---|---|---|
| 0 | Patterns/Note (%) | 35 | 09.36 | 33 | 09.34 | 0.02 |
| 2 | One-Time Patts/Tune (%) | 37 | 0.37 | 39 | 0.39 | 0.02 |
| 5 | Avg Interval w/Rests | 2.7 | 0.036 | 2.6 | 0.034 | 0.002 |
| 6 | Avg Interval w/o Rests | 2.7 | 0.2 | 2.6 | 0.19 | 0.01 |
| 7 | Common Patts (%) | 3.98 | 0.497 | 4.04 | 0.505 | 0.008 |
| 16 | Spread of Patt Freqs (Wtd) | 3.87 | 0.77 | 3.85 | 0.766 | 0.004 |
| 17 | Spread of Patt Freqs (Unwtd) | 3.07 | 0.628 | 3.12 | 0.638 | 0.01 |
| 22 | # Different Pitches | 11 | 0.17 | 12 | 0.19 | 0.02 |
| 26 | Normalized # Different Intervals | 20 | 0.22 | 22 | 0.24 | 0.02 |
| TOTAL | 0.12 |
Table 1 shows, somewhat surprisingly, that just one note difference by a minor second (MIDI difference of one) results in nine metrics that have different values between the two tunes. These differences are small and result in an accumulated difference of only 0.12. However, some of these metrics are correlated with each other, suggesting that perhaps we should consider adjusting our metrics to account for the correlations. At this stage of the analysis we are not going to make any such adjustments because which would have to be made for each pair of non-zero metrics and it’s not clear how one would go about that rigorously.
Example 2.
For our next example, instead of a pitch difference we explore two melodies whose only difference is a single note that differs by a major third interval. The two tunes are both called “Highland Reel,” which we distinguish here by appending #80 onto one of them, reflecting how it’s numbered in the original document, The Compleat Country Dancing Master, Volume VI, by John Walsh, published around 1756.
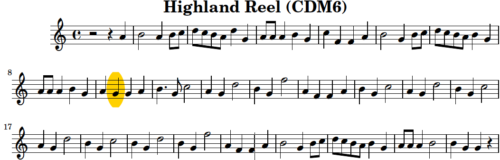
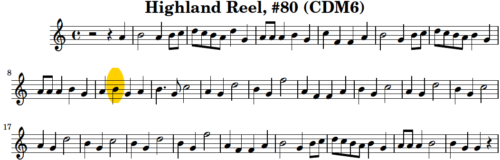
The only difference between the two tunes is in the eighth full measure where a “G” in the first variation is replaced by a “B” in the second (see yellow highlights in the figure at the left). Table 2 displays the eight metrics that are different between the two tunes. As with the previous set of tunes, the sum of the differences between the metrics is small, only 0.06. The difference in the sum of metrics for these two reels is half the difference of the previous set of tunes shown in Table 1.
Table 2 — Two Versions of Highland Reel
| Metric | Metric Name | Raw Metric, ver. 1 | Normalized, ver. 1 | Raw Metric, ver. 2 | Normalized, ver. 2 | Difference |
|---|---|---|---|---|---|---|
| 5 | Avg Interval w/Rests | 4.38 | 0.06002 | 4.42 | 0.06058 | 0.00056 |
| 6 | Avg Interval w/o Rests | 3.01 | 0.224 | 3.05 | 0.227 | 0.003 |
| 7 | Common Patterns (%) | 3.5 | 0.4378 | 3.4 | 0.4302 | 0.0076 |
| 12 | Run Length/Note | 1.56 | 0.12 | 1.58 | 0.12153 | 0.00153 |
| 15 | # Repeating Pitches | 12.5 | 0.136 | 11.4 | 0.125 | 0.011 |
| 16 | Spread of Pattern Freq (Wtd) | 3.6 | 0.712 | 3.5 | 0.704 | 0.008 |
| 30 | # Repeated Intervals | 4.17 | 0.048 | 5.21 | 0.06 | 0.012 |
| 32 | 3-Note Palindromes | 5.2 | 0.064 | 4.2 | 0.051 | 0.013 |
| TOTAL | 0.06 |
Example 3.
Shown are slightly different versions a tune from the middle part of the 17th century that has accumulated various names.
![Daphne [3] DM1651](https://horvathcampbell.com/wp-content/uploads/2016/08/Daphne-3-DM1651-e1472296799377.png)
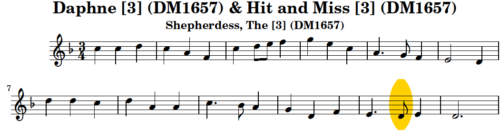
We will just call it “Daphne”. Like the previous example, these tunes vary by only one note: a “D” in one version is an “F” in the other, highlighted in yellow at the left. These two notes differ by a minor third (a MIDI value of “3”). We see in Table 3 that the sum of the differences of the metrics is small, once again reflecting the overwhelming similarity of the two versions of Daphne. Because the two melodies differ by just one note’s interval, the metrics involved are similar to those of the previous example.
Table 3 — Two Versions of Daphne, Written in 1651 and 1657
| Metric | Metric Name | Raw Metric, ver. 1 | Normalized, ver. 1 | Raw Metric, ver. 2 | Normalized, ver. 2 | Difference |
|---|---|---|---|---|---|---|
| 5 | Avg Interval w/Rests | 2.55 | 0.034 | 2.61 | 0.035 | 0.001 |
| 6 | Avg Interval w/o Rests | 2.55 | 0.19 | 2.61 | 0.194 | 0.004 |
| 7 | Common Patterns (%) | 3.58 | 0.447 | 3.63 | 0.453 | 0.006 |
| 16 | Spread of Pattern Freq (Wtd) | 3.66 | 0.724 | 3.6 | 0.716 | 0.008 |
| 17 | Spread of Pattern Freq (Un-Wtd) | 2.97 | 0.607 | 2.94 | 0.601 | 0.006 |
| TOTAL | 0.025 |
Example 4.
Our next example is from the early 18th century, two versions of the first half of a melody called “Northern Nancy,” one version from 1703 and another from 1721.
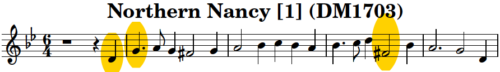
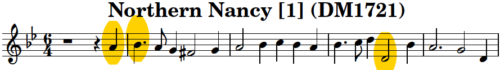
This example differs from the previous ones in that there are three differences between them and yet their metrics are quite close, as shown in Table 4 below. The three differences only relate to pitch; that is, the duration value for each note is identical between the two tunes, suggesting that the metric differences will be those having to do with pitch. We indeed find this to be the case in Table 4 where there are only four metrics with different value for the two melodies, three related directly to pitch.
Table 4 — Two Versions of Northern Nancy, Written in 1703 and 0721
| Metric | Metric Name | Raw Metric, 1703 version | Normalized, 1703 version | Raw Metric, 1721 version | Normalized, 1721 version | Difference |
|---|---|---|---|---|---|---|
| 5 | Avg Interval w/Rests | 5.58 | 0.077 | 6.11 | 0.084 | 0.007 |
| 6 | Avg Interval w/o Rests | 2.44 | 0.181 | 2.61 | 0.194 | 0.013 |
| 7 | Common Patterns (%) | 1.88 | 0.231 | 1.84 | 0.226 | 0.005 |
| 16 | Spread of Pattern Freq (Wtd) | 3.05 | 0.58 | 3.07 | 0.584 | 0.004 |
| TOTAL | 0.029 |
Example 5.
Now we turn to the well-known nursery rhyme “Three Blind Mice.’
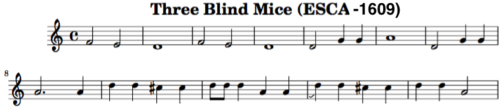
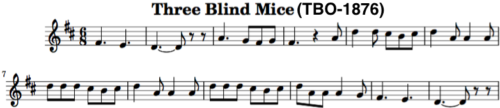
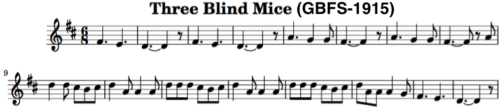
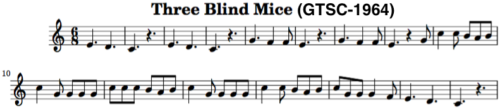
We can see at the left how this tune has evolved over its 350-year life to the modern form we know today. We choose this tune because it demonstrates how our metrics change as the melody evolves over the centuries. Table 5 shows just the metric differences among the various versions of the tune. It is clear from the table that the largest difference in metrics, 3.3, is between the earliest version of the tune in 1609 and the most recent version in 1964. The remainder of the table shows how the differences between the various metrics are proportional to the differences in the years published. In other words, the closer in time a version is published, the closer the metrics are to each other. The smallest metrics difference is 1.1, and that is for the versions published in the years 1876 and 1915–a span of only 39 years.
Table 5 — Metric Value Differences for Four Versions of “Three Blind Mice”
| Year Published | 1609 | 1876 | 1915 | 1964 |
|---|---|---|---|---|
| 1609 | 0 | 2.7 | 3.1 | 3.3 |
| 1876 | 0 | 1.1 | 1.2 | |
| 1915 | 0 | 1.6 | ||
| 1964 | 0 |
Example 6.
In this example we compare two tunes whose only difference is that a few eighth notes are transformed into sixteenth notes, encircled in red.
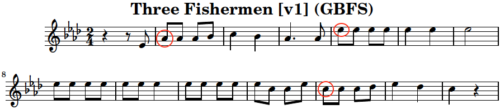
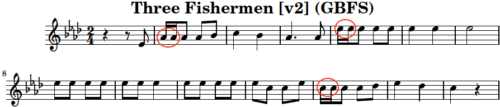
The tunes are different versions of Three Fishermen as found in the Golden Book of Favorite Songs, published in 1915. Table 6 below compares the metrics between these two variations.
Table 6 — Variations of ‘Three Fishermen’
| Metric # | Metric Name | Raw Metric, Carey | Normalized, Carey | Raw Metric, Mask | Normalized, Mask | Difference |
|---|---|---|---|---|---|---|
| 0 | Patterns/Note (%) | 42.5 | 0.44 | 41.9 | 0.43 | 0.01 |
| 1 | # One-Time Patterns | 12 | 0.13 | 14 | 0.15 | 0.02 |
| 2 | One-Time Patts/Tune Patts (%) | 71 | 0.71 | 78 | 0.78 | 0.07 |
| 3 | One-Time Patts/Note (%) | 30 | 0.318 | 33 | 0.345 | 0.03 |
| 4 | # Rests/Note | 2.5 | 0.053 | 2.3 | 0.05 | 0.003 |
| 5 | Avg Interval w/Rests | 4.4 | 0.0597 | 4.0 | 0.0554 | 0.004 |
| 6 | Avg Interval w/o Rests | 0.95 | 0.07 | 0.88 | 0.06 | 0.01 |
| 7 | Common Patts (%) | 4.7 | 0.584 | 4.3 | 0.536 | 0.05 |
| 10 | Avg Duration Ratio | 1.09 | 0.026 | 1.12 | 0.032 | 0.006 |
| 11 | Runs/Note (%) | 20 | 0.19 | 19 | 0.18 | 0.01 |
| 14 | # Repeating Durations | 72 | 0.73 | 60 | 0.61 | 0.12 |
| 15 | # Repeating Pitches | 60 | 0.65 | 63 | 0.68 | 0.03 |
| 16 | Spread of Patt Freqs (Wtd) | 2.9 | 0.54 | 3 | 0.57 | 0.03 |
| 17 | Spread of Patt Freqs (Unwtd) | 3.1 | 0.64 | 3.2 | 0.65 | 0.01 |
| 24 | # Different Durations | 4 | 0.11 | 5 | 0.15 | 0.04 |
| 26 | Normalized # Different Pitches | 17 | 0.186 | 16 | 0.172 | 0.014 |
| 27 | Normalized # Intervals | 15 | 0.2 | 14 | 0.19 | 0.01 |
| 28 | Normalized # Durations | 10 | 0.15 | 12 | 0.18 | 0.03 |
| 29 | Normalized # Duration Ratios | 15 | 0.2 | 14 | 0.19 | 0.01 |
| 30 | Repeated Intervals (%) | 52 | 0.6 | 56 | .064 | 0.04 |
| 31 | Repeated Duration Ratios (%) | 55 | 0.6 | 35 | 0.4 | 0.2 |
| 32 | 3-Note Palindromes (%) | 5 | 0.06 | 2 | 0.03 | 0.03 |
| TOTAL | 0.78 |
Example 7.
For an example of how the metrics work when a tune’s variations occur within a relatively short time period, we turn to Bouzer Castle, a Scottish tune with five variations published in John Playford’s Dancing Master for each of the years 1679, 1689, 1698, 1703, and 1721. Unlike the previous examples, the highlighted notes for Bouzer Castle are those that differ from the majority of the other versions. For instance, the first highlighted note in the 1679 version of Bouzer Castle is a middle C, which differs from the final three versions (1698, 1703, and 1721) by an octave.
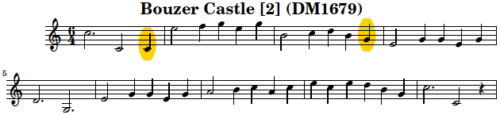
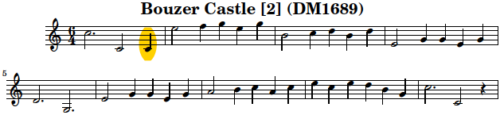
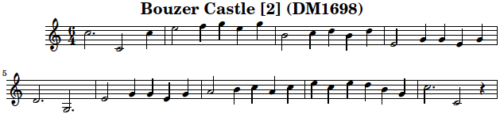
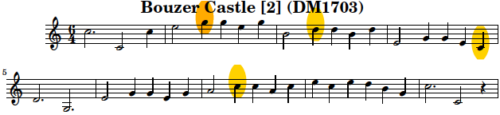
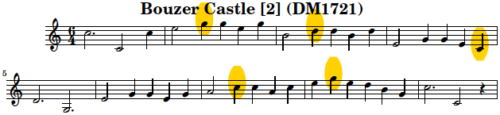
Table 7 compares the metric values for each possible pair of versions of Bouzer Castle. The two most similar versions, which differ by only a single pitch, are 1689 and 1698 with a metric difference of only 0.11. The two versions that differ the most are those written in 1689 and 1721 with a metric difference of 0.70. These two versions differ by a total of six notes, each a pitch difference (see the yellow highlight in the 1689 version and the five yellow highlights in the 1721 version). The oldest and most-recent versions differ the most, as they did for Three Blind Mice. Their metric difference is only 0.58 but reflects seven pitch differences.
Table 7 — Sum of Metric Values for Five Versions of “Bouzer Castle”
| Year Published | 1679 | 1689 | 1698 | 1703 | 1721 |
|---|---|---|---|---|---|
| 1679 | 0 | ||||
| 1689 | 0.14 | 0 | |||
| 1698 | 0.12 | 0.11 | 0 | ||
| 1703 | 0.65 | 0.65 | 0.62 | 0 | |
| 1721 | 0.58 | 0.70 | 0.24 | 0.24 | 0 |
These examples are promising in that they suggest these metrics may be valuable in quantifying the similarities among tunes. Small differences in tunes reflect small differences in the metrics, which can be summed to a single number to represent those differences, if somewhat crudely. Whether these metrics prove valuable in comparing various melodies, however, will have to wait a more exhaustive research effort to explore that question.