The following figure shows Chernoff Faces for 72 tags. We will walk through a few of them to explain why portraying melodic data visually is useful.

Comparison of Musical Genres
We start with the faces for melodies used in film and tv, shown in Figure 2. The thicker hair for film tunes indicates a larger count of different 2-note patterns than for TV music. The slightly different slant of the eyes indicates that more pitches repeat in TV melodies than for film melodies. The smaller eyes for film tells us that film music doesn’t use as wide a variety of 2-note patterns. Finally, the wider nose on film’s “face” suggests that film melodies have a larger number of different duration ratios.
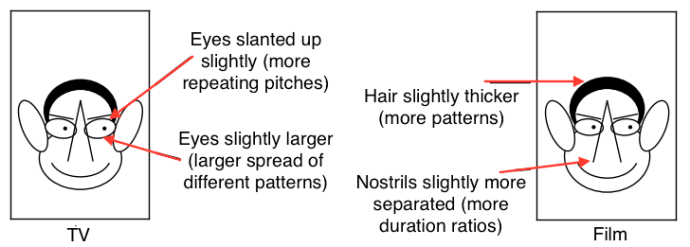
We can quantify these differences by looking at the corresponding metric values for each of these genres, as shown in Table 1. For each facial feature, we see that the metric is indeed larger or smaller as described in the previous paragraph. Even those these differences are very slight, the eye picks them up in the Chernoff faces, indicating the power of using faces to plumb complicated data.
| Facial Feature | Corresponding Metric | TV | Film |
|---|---|---|---|
| Hair | Average Number of Different 2-Note Patterns in Tune | 39.6 | 41.9 |
| Eye Size | Weighted Average Spread of 2-Note Pattern Frequencies | 3.15 | 3.11 |
| Eye Slant | Average Number of Pitches That Repeat Consecutively | 18.6 | 17.1 |
| Nostril Separation | Average Number of Different Duration Ratios | 13.4 | 14.3 |
Critique of Chernoff Faces
Chernoff Faces have both advantages and disadvantages to viewing large amounts of data, and a number of critiques have pointed out the flaws. For instance, Robert Kosara published a paper in which he summarizes research by Colin Ware that, “the perceptual space of Chernoff Faces is likely to be extremely nonlinear.” By this he means that moving a particular facial feature a specific amount may affect facial recognition more or less than moving another facial feature by the exact same amount. Morris, et al, found that, of the face features studied, eye size and eyebrow slant produced the most accurate identification of specific data. In other words, some facial features convey more facial recognition information than others. That in turn means that use of Chernoff Faces may depend too much on how one assigns the data to various facial features, and that a different assignment may produce different results. They also found that Chernoff Faces do not take advantage of a human’s ability to something called “pre-attentive visual processing,” in which the brain filters and processes what is important from an unconscious accumulation of information. If that is the case, Morris points out, humans must process Chernoff Faces serially and may not have an advantage over other methods of displaying multivariate data.
Refer again to Figure 2 above comparing film and television as an example of where Chernoff faces fail. Observe that for both faces the spot where the top half of the face joins the lower half of the face are both hidden behind the eyes. The metric for the face joint is the average number of runs per note, and the normalized data is 0.36 for film and 0.27 for TV, a difference of nearly 0.1 and large enough to be noticeable. This example illustrates one of the drawbacks of Chernoff faces: human recognition does not treat all facial features equally.
While we acknowledge the validity of these critiques, we have found Chernoff Faces to be useful in quickly discerning whether, say, two musical genres have very little or very much in common with each other. As the critiques make clear, Chernoff Faces are not useful for identifying small differences between musical genres or between melodies. For detailed analysis, it will be necessary for us to undertake a more rigorous, quantitative analysis in the future.
Comparing Similar Musical Genres
To explore how Chernoff Faces work, let’s look at a pair of genres that common sense tells us are closely related: lullabies and nursery songs. We would expect these two musical categories to be similar as they are both geared for children. Lullabies, of course, are designed to be sung to infants, while nursery tunes are for older children, but we would expect some similarities.
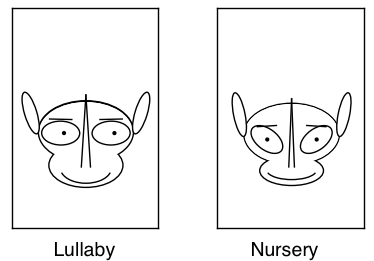
Indeed, we find such similarities as well as many differences, as shown in Figure 3, and we will confine our discussion to a few examples of each, but we’re going to examine them in some detail. These two musical genres comprise a good pairing because there is a nice balance of similarities and differences. Explaining the metrics for those similarities and differences will allow us to demonstrate how the metrics work, how well the human brain discerns subtle differences, and how we can use that facility to explore music.
The obvious similarities are baldness, ears, the nose, and eyebrows. The obvious differences are the size of the whole face (much larger for nursery tunes), eyes, and the smile. What these differences mean in terms of our metrics is shown in Table 2.
Table 2. Lullaby Metrics Compared to Nursery Tune Metrics
| Metric ID and Name | Facial Feature | Lullabies (raw) | Nursery Songs (raw) | Lullabies (normalized) | Nursery Songs (normalized) |
|---|---|---|---|---|---|
| 00 Number of patterns in tune (avg) | Hair thickness | 26 | 22 | 0.07 | 0 |
| 01 Percent of different patterns in a single tune (avg) | Forehead width | 41 | 41 | 0.83 | 0.83 |
| 02 Number of patterns occurring exactly once (avg) | Face height | 11 | 10 | 0.18 | 0.13 |
| 03 Patterns occurring exactly once as % of # tune patterns (avg) | Ear dangle angle | 44 | 46 | 0.71 | 0.76 |
| 04 Patterns occurring exactly once as % of # tune notes (avg) | Eye separation | 20 | 20 | 0.77 | 0.79 |
| 05 Number of rests/note (avg) | Smile width | 4 | 4 | 0.4 | 0.39 |
| 06 Absolute interval (avg) | Jaw width | 7 | 6 | 0.34 | 0.25 |
| 07 Relative interval (avg) | Vertical position of eyes | 2.3 | 2.1 | 0.24 | 0.10 |
| 08 Frequency of patterns (avg) | Location of pupils | 3.1 | 3.4 | 0.33 | 0.48 |
| 09 Unused | |||||
| 10 Range of pitches (avg) | Forehead Height | 14 | 13 | 0.05 | 0.02 |
| 11 Duration ratio (avg) | Smile | 1.4 | 1.2 | 0.54 | 0.34 |
| 12 Number of runs per note (avg) | Joining of forehead and jaw | 0.4 | 0.36 | 0.32 | 0.14 |
| 13 Run length (avg) | Eye squint | 1.9 | 1.9 | 0.4 | 0.4 |
| 14 Run length maximum (avg) | Shape of ears | 4.3 | 4.2 | 0.11 | 0.07 |
| 15 Unused | |||||
| 16 Number of repeating pitches (avg) | Eye slant | 16 | 25 | 0.5 | 0.8 |
| 17 Wtd avg spread of pattern frequencies (avg) | Eye size | 3.22 | 3.20 | 0.43 | 0.40 |
| 18 Unweighted avg spread of pattern frequencies (avg) | Vertical position of mouth | 2.7 | 2.8 | 0.73 | 0.84 |
| 19 Unused | |||||
| 20 Pick-up note percent of measure (avg) | Ear size | 13 | 14 | 0.34 | 0.36 |
| 21 Duration ratio going into rests (avg) | Vertical position of eyebrows | 0.53 | 0.6 | 0.19 | 0.23 |
| 22 Duration ratio coming from rests (avg) | Eyebrow angle | 0.59 | 0.52 | 0.52 | 0.44 |
| 23 Unused | |||||
| 24 Number of different intervals (avg) | Eyebrow length | 11 | 10 | 0.08 | 0.02 |
| 25 Unused | |||||
| 26 Number of different duration ratios (avg) | Nostril separation | 8 | 7 | 0.16 | 0.1 |
| 27 Unused | |||||
| 28 Normalized number of different pitches (avg) | Vertical position of ears | 19 | 20 | 0.8 | 0.9 |
| 29 Unused | |||||
| 30 Normalized number of different duration ratios (avg) | Nose length | 14 | 13 | 0.9 | 0.8 |
| 31 Unused |
Lullaby Metrics Versus Nursery Metrics
Hair Thickness. Consider the very first metric, hair thickness, that is determined by the number of different 2-note patterns in a tune. Here’s an example of where the eye fails to pick up a slight difference. Both lullaby face and the nursery face appear bald, but the metrics show that lullabies have, on average, 26 different 2-note patterns per tune, whereas nursery songs have only 22. When we normalize those values over all genres, we get 0.07 and 0, respectively (see Table 2). The normalized values range from 0 to 1, so the zero value for nursery songs indicates that those melodies have the lowest number of patterns per tune of any musical genre in the database. That is consistent with our expectation that songs for children would be simple. The normalized value for lullabies is only 0.07 (remember, the scale is 0 to 1), so lullabies have marginally more patterns per tune than nursery songs. Now that we know that, examining the hairline of the two faces in Figure 3 does reveal that the hairline for lullabies is ever so slightly thicker than that for nursery songs.
Forehead Width. The forehead widths of the two faces are exactly the same because the metric that governs forehead width, the number of different patterns in a tune as a percent of the number of notes in that tune, works out to be identical for lullabies and nursery songs. On average, 41 of the patterns in both lullabies and nursery tunes are made up of different 2-note patterns (see Table 2). The normalized value (on a 0-1 scale) is 0.83, and that’s relatively high. It may appear counterintuitive that such a high percent of different patterns in simple songs would be so high, but remember that both lullabies and nursery songs tend to be made up of few notes. This attribute is also true for other genres that are made up of easy-to-sing tunes, such as hymns, which as a genre has an even higher percent of different patterns per note (45 percent). At the other end of the spectrum are baroque tunes. A Vivaldi piece, for instance, on average contains only 18 percent different patterns, because the pieces are both relatively long and made up of relatively few different patterns.
The Smile. The smile is defined by three metrics that determine the vertical position, the width, and the curvature of the smile.
Width. The width of each smile is governed by the average number of rests per note in the songs of each genre, which has a value of four for both lullabies and nursery songs so the smile has the same width in both faces.
Curvature. The degree to which the face is smiling is determined by the average duration ratio of the 2-note pairs in each genre. Lullabies and nursery tunes have an average duration ratio of 1.4 and 1.2, respectively. This difference can be explained by remembering that lullabies are designed to be soothing. Longer duration ratios indicate that there are more notes of long duration followed by notes of short duration than the other way around, and a long-short pattern tends to be more calming than the burst of a short-long pattern. The eye can easily discern the different curvatures.
Vertical Position. The vertical position of the smile is governed by the unweighted average spread of pattern frequencies, which are 2.7 and 2.8 for lullabies and nursery songs, respectively. These are almost the same, indicating that the two genres don’t differ much in terms of the variety of how often each uses different 2-note patterns. Indeed, the heights of the two mouths appear about the same.
Eyes. Because of the importance of eyes on a face, six metrics are assigned to draw them. For lullabies and nursery songs, the two obvious differences are that the eyes are slanted for nursery songs and the pupils are looking to the side for lullabies. Here’s the detailed breakdown by metric:
Eye Separation. The distance the eyes are separated is governed by the average number of times a 2-note pattern occurs just once in a tune as a percent of the total number of 2-note patterns in that tune. That average is 20 for both lullabies and nursery songs, so the eye separation is the same.
Vertical Position of Eyes. How high or low the eyes are on the face is determined by the average interval when rests are removed. That metric has values of 2.3 and 2.1 for lullabies and nursery songs, respectively. It’s a subtle difference, in part because the face height for nursery songs is slightly less than that for lullabies, but it is clear that the eyes for nursery songs are slightly lower than those for lullabies. This observation is a good example of one of the criticisms of Chernoff Faces, as the interactive effects of the features making up a face muddy our ability to cleanly ascribe one metric to one feature.
Location of Pupils. Where the pupils are located in the eyes is controlled by the use of common 2-note patterns, expressed as the average percent of the frequency that each pattern occurs in the entire database: The higher the average, the more common the patterns in the tune. The metric’s values for lullabies and nursery songs, respectively, are 3.1 and 3.4, respectively, and the normalized values are 0.33 and 0.48, respectively on a scale of 0 to 1. While that’s not a large difference, it is readily apparent in Figure 3 that the eyes for lullabies are “looking” to the viewer’s right, whereas the eyes for nursery songs are “looking” straight at the viewer. The difference in this metric for the two genres means that nursery songs have slightly more common 2-note patterns than lullabies do, and is a striking example of how powerful facial recognition can be.
Eye Squint. The degree to which the eyes are squinting depends on the average run length in each genre: 1.9 notes per run for each genre (on average, notes for both genres contain melodies that move two notes in one direction, up or down, before reversing and going the other way). There is no difference between the two genres and the normalized value is 0.4, toward the middle of the scale. The eyes appear to many viewers to be squinting more for nursery songs than for lullabies, but that results from the eyes being larger for lullabies, as we shall see.
Eye Slant. The slant of the eyes is managed by the average number of pitches (MIDI values) that repeat. For lullabies this value is 16 and for nursery songs it is 25, a noticeable difference. Nursery songs have more consecutive notes where the pitch is the same than do lullabies. The higher slant value is clearly visible in the face for nursery songs, which has slanted eyes compared to those for lullabies.
Size of Eyes. The weighted average spread (standard deviation) of 2-note pattern frequencies governs the size of the eyes. This metric has a value of 3.25 for lullabies and 3.20 for nursery songs, a small difference that is nonetheless observable in the two faces. In simple terms, this difference means that the 2-note patterns used in lullabies are slightly more diverse than those for nursery songs.
Eyebrows. Eyebrows are defined by their vertical position, angle, and length on the face. Vertical position and angle are governed by average duration ratios going to rests and coming from rests, respectively.
Vertical Position. The vertical position of the eyebrows is determined by the average value of duration ratios when the melody encounters a rest (metric #21 in Table 2). For lullabies that metric has a value of 0.6 and for nursery songs it is 0.53. However, the position of the eyebrows on the face is also governed by the vertical position of the eyes because it would not be acceptable to draw the eyebrows below the eyes. This interactive effect makes it difficult to visually discern any difference in eyebrow position in Figure 3.
Angle. Metric #22, average duration values coming from rests, have roughly the same difference–0.59 and 0.52, respectively for lullabies and nursery songs, but the angle difference in the eyebrows is easy to see in the figure. This example is illustrative of one problem with using Chernoff faces to interpret data, as interactive effects are hard to interpret.
Length. The length of the eyebrows is controlled by the number of different pitch differentials (intervals), which metric #24 shows to be 11 and 10, respectively, for lullabies and nursery songs. Those are very close in value and the eyebrows look the same length in Figure 3.
Ears. Ears are drawn according to the four metrics affecting their slant (dangle), shape, size, and vertical position on the face.
Slant or Dangle Angle. Metric #3, the average number of patterns occurring exactly once in a tune as a percent of that tune’s patterns, governs the angle the ears slant. That metric’s raw values for lullabies and nurseries are 44 and 46, respectively, and even though this difference is only two percentage points, one can discern that the ears on the nursery face are slightly steeper than those on the lullaby face own Figure 3.
Shape. Likewise for metric #14, the maximum run length in each genre, the raw values are 4.3 and 4.2, but one can see that the ears on the lullaby face are slightly thicker.
Size. Ear size is drawn using metric #20, the average duration of pick-up notes at the beginning of the tune as a percent of the duration of the fist measure, which has raw values of 4.3 and 4.2, respectively, for lullabies and nursery songs. This slight difference is not easily discerned in Figure 3 as neither pair looks larger or smaller than the other.
Vertical Position. Likewise, the small difference in the vertical position of the ears is all but impossible to notice in Figure 3, reflecting only a slight difference in the values of metric #28, the number of different pitches in a tune normalized by the length of the tune. Those raw values for lullabies and nursery songs are 19 and 20, respectively.
Nose. The simple nose on our Chernoff face is drawn using two parameters: the distance between the nostrils and the length of the lines making up the nose.
Nostril Separation. The distance separating the two nostrils is determined by metric #26, the average number of different duration ratios. The values of nostril separation for lullabies and nursery songs from Table 2 are 8 and 7, respectively, a small difference that can nonetheless be seen in Figure 3; the nostrils for lullabies are clearly wider than those for nursery songs.
Length. The length of the lines drawing the sides of the nose are determined by the average number of duration ratios normalized by the number of notes in a tune, metric #30. The values for nose length are 14 and 13, respectively for lullabies and nursery songs, and one can discern that the nose for lullabies is slightly longer in Figure 3.
Facial Shape. The shape of the face is managed with four features: Forehead width, face height, jaw width, and the spot where the forehead is joined with the jaw.
Forehead Width. The width of the top part of the face is controlled by metric #1, the average number of patterns within a tune normalized by the number of notes in that tune. For lullabies and nursery songs, this value is 41 for both, so the forehead widths are the same in Figure 3.
Face Height. The top-to-bottom length of the face is governed by metric #2, the average number of times a pattern occurs exactly one time in a tune. For lullabies and nursery songs, these values are 11 and 10, respectively. Though the difference is slight, it can be seen in Figure 3.
Jaw Width. The width of the jaw is determined by the average interval when rests are included, metric 6. The values for lullabies and nurseries, respectively are 7 and 6. Indeed, the jaw for lullabies is wider than that for nursery songs.
Facial Joint. Where the forehead joins with the jaw is determined by metric #12, the average number of runs normalized by the number of notes in a tune. The values are 0.4 and 0.36, respectively, for lullabies and nursery songs. In many faces, this joint is obscured by another facial feature, but in Figure 3 we can see that the joint is higher on the face for lullabies than for nursery songs.
Comparison of Individual Tunes
It’s also possible to draw faces for individual tunes, though that is arguably less useful. To see why, it is necessary to understand that the metrics for a genre, such as lullabies, are averaged from all the individual lullaby tunes. The averaging process eliminates the extremes, the minimums and maximums. Individual tunes contain those extremes, so if we use them to draw faces, which are based on the averages of musical genres, facial features could be plotted in extreme positions, even off the face. We correct for that by drawing the face for an individual tune after constraining each metric to its minimum and maximum as computed for all genres. This guarantees that the mouth, for instance, is on the face rather than below it, but distorts the true set of metrics for the tune. The results are interesting but mixed. We will go through an example to demonstrate.
Nursery Rhymes–Good Matchup Example
When Chernoff faces work for individual tunes, they work well. We use the musical genre of nursery rhymes for our example because children’s songs tend to be simple. Figure 4 compares the Chernoff faces of the children’s song, John Henry (as depicted in the 1948 songbook, American Folk Songs for Children):
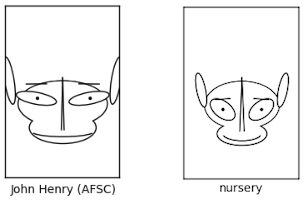
The similarities between the two faces on the left are fairly clear, demonstrating how this version of John Henry fits well into one of its genres (nursery rhymes). On both faces notice the lack of hair, the shape and angle of the ears, the nose, and the smile, among other similar features. There are a few differences, such as the width of both the upper and lower face, the eye squint and eyebrow placement, but even with those facial features there are some similarities. For instance, the pupil placement in the eyes is similar and the eyebrows, though placed different vertically, have similar angles and lengths. Here’s how the metrics that drew the faces compare numerically:
Table 3–Comparison of John Henry Metrics with Nursery Genre Metrics
| Chernoff Metric | John Henry Metrics | Nursery Song Metrics | Music Metric |
|---|---|---|---|
| Forehead Height | 0.70 | 0.72 | Pitch range |
| Face Joint | 0.32 | 0.14 | Number of runs per note |
| Face Height | -0.32 | -0.35 | Number of patterns occurring exactly once |
| Forehead Width | 1 | 0.83 | Percent of different patterns in tune |
| Jaw Width | 0.74 | 0.55 | Average interval (includes rests) |
| Nose Length | 0.78 | 0.81 | Normalized number of different duration ratios |
| Mouth, Vertical Position | -0.44 | -0.45 | Unweighted average spread of pattern frequencies |
| Smile | 0.23 | 0.34 | Average duration ratio |
| Smile Width | 1.4 | 0.88 | Number of rests per note |
| Eyes, Vertical Position | 0.31 | 0.09 | Average interval (excluding rests) |
| Eye Separation | 0.14 | 0.11 | Patterns occurring exactly once as % of number of notes |
| Eye Slant | 0.19 | 0.65 | Number of repeating pitches |
| Eye Squint | 0.29 | 0.57 | Average run length |
| Eye Size | 0.92 | 0.65 | Weighted average spread of pattern frequencies |
| Pupil Placement | -0.05 | -0.02 | Average frequency of patterns |
| Eyebrow, Vertical Position | 0.06 | 0.06 | Average duration ratio going into rests |
| Eyebrow Slant | -0.01 | -0.03 | Average duration ratio coming from rests |
| Eyebrow Length | 0.25 | 0.26 | Number of different intervals |
| Nostril Separation | 0.03 | .050 | Number of different duration ratios |
| Ear Size | 1.1 | 0.79 | Pick-up note(s) duration as % of measure duration |
| Ear Angle | 1.4 | 1.4 | Patterns occurring exactly once as % of # patterns in tune |
| Ear Shape | 0.20 | 0.26 | Maximum run length |
| Ear, Vertical Position | 0.71 | .53 | Normalized number of different duration ratios |
| Hair | 0.04 | 0 | Number of different patterns in tune |
Scanning down the two numerical columns, one can see that there is a strong similarity between the metrics for John Henry and those for nursery songs in general, particularly with respect to the pitch range, the number of patterns occurring exactly once, the unweighted spread of pattern frequencies, the average duration ratio going into rests, the number of different intervals, and the number of patterns occurring exactly once as a percent of the number of patterns in a tune. Notable differences are in the average interval including rests (jaw width), the number of rests per note (smile width), the average interval excluding rests (vertical position of the eyes), the number of repeating pitches (eye slant), and pick-up note duration as a percent of the first measure’s duration (ear length).
Nursery Rhymes–Bad Matchup Example
Figure 4 demonstrates that when Chernoff faces work, they work well. Figure 5, however, is much more representative of applying the Chernoff methodology to a single tune within a genre. The nursery tune is “Polly Put the Kettle On” as it appeared in Walter Crane’s Baby’s Bouquet written in 1878:
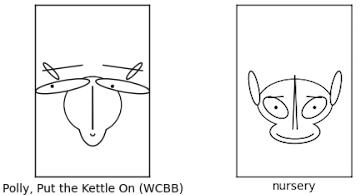
A quick visual inspection reveals that the two faces have little in common. The eyes, ears, smile, and eyebrows, among other features, are quite different. In fact, there are only three similarities, but they point us in the direction of how to value melodic metrics when determining the genre of a particular tune: 1) The vertical position of the mouth, which indicates that the song and the genre both have close to the same spread of pattern frequencies. 2) The shape of the ears, suggesting that the maximum run lengths are similar. 3) The lack of hair, indicating the same number of different two-note patterns.
This kind of comparison will inform our more rigorous numerical analysis of the melodic metrics to compare tunes and genres.
Families of Tunes — Tunes Derived from Each Other
Tunes that may be derived from each other or evolve over time into variations of each other are called “families of tunes.” For our first example, we turn to an old Scotch tune, Bonny Dundee, that has many variations, a few of which are shown here:
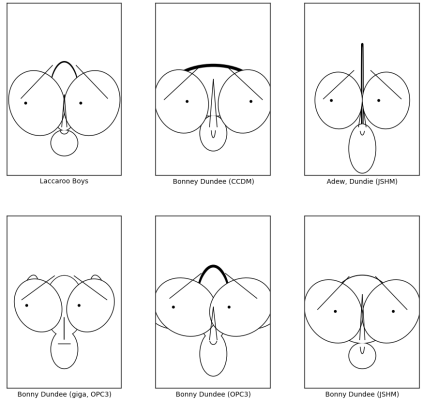
The similarities within this family of tunes are fairly obvious in their Chernoff faces. Because most people, even some musicians, would not be familiar with this ancient tune, we provide the first few bars of each below in standard music notation to help explain how the facial similarities correspond with the musical notation similarities.
Perhaps the most prominent feature is the large eyes in all six versions of Bonny Dundee. The size of the eyes is proportional to the weighted average spread of pattern frequencies–in other words, the large eyes are due to a relatively wide set of common and not-so-common two-note patterns. The eyes range in size, using our metric, from 1 to 1.25, more than twice the metric for most tunes. It is hard to tell without doing the analysis, but the musical notation below does suggest a wide variety of different patterns, either by using a wide variety of intervals, duration ratios, or both.


This set of Bonny Dundee samples demonstrates how much the tune has evolved over 250 years.
Another common feature of the Bonny Dundee faces is the hair, which is thin or bald for all versions of the song. Hair thickness is proportional to the number of different patterns in a tune, and these tunes have, relatively speaking, a small number of different patterns, largely because they lack tied notes and large intervals, features common to many folk tunes.
Sometimes it is instructive to look at a set of Chernoff faces and look for a feature that is different from the others. One feature that fits that description in Figure 6 is the smile. All the faces have a curvy smile except the face for Bonny Dundee (giga). The curve of the smile is dictated by the average duration ratio of the tunes. Looking at the notes for the giga (gigue or jig), we immediately notice that the notes are mostly eighth notes, whereas in the other tunes the duration of the notes have a broader mix of eighth notes, dotted eighth note, sixteenth notes, and quarter notes. The average duration ratio for the giga is close to zero when normalized, which means that it’s at the extreme low end of the tunes when it comes to this metric. It’s raw value is close to one, reflecting the fact that there are a lot of notes of the same duration following each other. Most jigs would have this feature, of course, and it doesn’t tell us anything we don’t already know, but is a good example of how to use Chernoff faces to pull out a feature that makes a tune different from others.
For our last example using this family of tunes, observe that the forehead widths of the faces in Figure 6 are fairly wide except for Adew, Dundee. The forehead for that tune is quite narrow, giving him a pointy head. Forehead width is governed by the number of different patterns in a single tune expressed as a percent of the notes in the tune. Glancing at the notes for each tune, one might surmise that the giga form of Bonny Dundee might have the narrowest forehead because of its almost exclusive use of eight notes, which means that most patterns would be differentiated only by the interval. But the numbers tell a different story. The normalized metric for the percent of different patterns is 0.007 for Adew, Dundee, but 0.44 for the giga form of Bonny Dundee. Although Adew, Dundee uses a mix of eighth notes and quarter notes, it tends to use the same intervals over and over again, notably the major second and minor third intervals. At the other end is the Bonney Dundee version from 1735 (Compleat Country Dancing Master), for which the normalized percent of different patterns is 0.996. This rather high value results from the use of dotted notes along with a wide variety of basic note durations (quarter, half, and eighth notes) and a wider variety of intervals than the other versions.