Everyone to some extent has the ability to differentiate styles of music from one another. No one would confuse a classical cantata with a rock song. And although they were both developed in the same century, people can easily tell the difference between a country-western tune and a Broadway show tune. Of course, the human brain uses all information available to it when making such distinctions–instrumentation, the beat or rhythm, dynamics, tone quality, and harmony to cite a few examples. But the melody itself contains information that varies enough among musical genres to show distinctions.
One goal of the Skiptune project is to find out how much of that human ability to distinguish musical genres is due to melody alone. It seeks to answer the question, “Are there measurable differences between styles of tunes?” Are the melodies used for jazz piece different in some measurable way from Irish jigs? Are tunes written in American essentially the same as those written in Europe, or are there basic differences? The field of research that studies such differences is called ethnomusicology, a rich field of effort that explores much more than mere melody to explain cultural differences in music. The Skiptune project isolates the tune (melody) itself from economic differences, historical context, and other cultural distinctions to see if melodies alone reflect those distinctions.
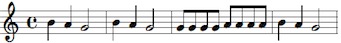
To explore stylistic differences in various melodies, we need metrics–measurable facts about a melody or tune. So far we’ve identified over thirty such metrics. Their formal definitions follow, but to make it easier to understand them, each will include an example using a well-known nursery melody, Hot Cross Buns. Here’s the standard musical notation of that melody, followed by a description of each metric:
As an aid to the reader in following along with the metric descriptions, we note all the two-note patterns here. There are seven different such patterns in Hot Cross Buns:
[-2,1] where a quarter note B is followed by a quarter note A [-2,2] where a quarter note A is followed by a half note G [4, 0.5] where a half note G is followed by a quarter note B [0, 0.25] where a half note G is followed by an eighth note G [0,1] where an eighth note G is followed by another eighth note G [2,1] where an eighth note G is followed by an eighth note A [2,2] where an eighth note A is followed by a quarter note GThe Metrics
The two pieces of information needed before diving into each metric is that for some metrics we will need to know the number of notes in the tune so we can normalize certain metrics. For Hot Cross Buns, the number of notes is 17, which you can verify by simply counting the number of notes in the tune above.
1. Percent of Different Patterns Within a Tune
The number of different two-note patterns divided by the number of notes in the tune, expressed as a percent.
Example: This metric has a value of 7/17 = 41% for the Hot Cross Buns example. There are 17 notes in this tune and seven different patterns (see “Number of Patterns in Tune.”
2. Number of Single-Occurrence Patterns
The number of two-note patterns that occur only once within a tune.
Example: For Hot Cross Buns, this metric is four. Referring to Figure 1, the four two-note patterns that occur only once each are (1) the half note G to quarter note B in the first measure, (2) the half note G to the eighth note G in the second to third measure, (3) the G eight note to the A eighth note in the middle of the third measure, and (4) the eighth note A to the quarter note B in the third to fourth measure.
3. Single-occurrence Patters as a Percent of Tune Patterns
The number of two-note patterns that occur only once within a tune divided by the number of different two-note patterns in that tune, expressed as a percent.
Example: For Hot Cross Buns, this metric has a value of 57 percent because there are four patterns that occur exactly one time in the tune and a total of seven different patterns in the tune. 4/7 = 57%.
4. Single-occurrence Patterns As a Percent of Notes
The number of two-note patterns that occur only once within a tune divided by the number of notes in that tune, expressed as a percent.
Example: For Hot Cross Buns, this metric has a value of 4/17 = 24%. There are four patterns that occur only once (see previous metric) and 17 notes.
5. Number of Rests Per Note
The number of rests divided by the number of notes within a tune, expressed as a percent (consecutive rests are treated as one long rest, the duration of which is the sum of all the individual rest durations).
Example: For Hot Cross Buns, this metric has a value of zero because there are no rests. If there had been, say, one rest of any duration, this metric would have had a value of 1/17.
6. Absolute Pitch Change Average
The average interval between each pair of notes, including rests. Each interval is counted as a positive integer; that is, a major 2nd interval is counted as a “2” regardless of whether it’s an increasing or decreasing pitch change. If there are any rests in the tune, this metric includes the jumps to and from those rests, each valued at the difference between the MIDI value and zero (because a rest is defined as a MIDI value of zero). This metric accounts for the theory that the human ear interprets rests as silence and a break from the pitches that precede or follow the rest.
Example: For Hot Cross Buns, this metric has a value of 1.25 because that’s the average of the following intervals in the tune: 2, 2, 4, 2, 2, 0, 0, 0, 0, 2, 0, 0, 0, 2, 2, 2.
7. Relative Pitch Change Average
The average interval between each pair of notes, but eliminating the effect of rests. This metric takes into account the theory that the human ear doesn’t interprets rests as silence, but instead connects the surrounding notes.
Example: For Hot Cross Buns, this metric has a value of 1.25, the same as that for Absolute Pitch Change, because there are no rests in the tune. In a tune with rests, the value of Relative Pitch Change would be lower than that for Absolute Pitch Change because each change to and from a rest has a value of 42, which is much larger than most intervals.
8. Use of Common Patterns (%)
The average of the overall frequency of each two-note pattern weighted by the number of times it appears in that tune. “Overall frequency” is the number of times that particular two-note pattern appears in the database as a whole, expressed as a percent of all such frequencies. This measurement quantifies whether the tune has relatively common or uncommon two-note patterns.
Example: In Hot Cross Buns this metric has a value of 5.35. Here are the frequencies for each pattern in the example:
Table 1 –Use of Common Patterns in Hot Cross Buns Example
| Pattern | Frequency | # in Tune | Product |
|---|---|---|---|
| [-2,1] | 10.9 | 3 | 32.7 |
| [-2,2] | 1.8 | 3 | 5.4 |
| [4, 0.5] | 0.3 | 1 | 0.3 |
| [0, 0.25] | 0.2 | 1 | 0.2 |
| [0,1] | 6 | 6 | 36 |
| [2,1] | 9.3 | 1 | 9.3 |
| [2,2] | 1.7 | 1 | 1.7 |
| Sum | 16 | 85.6 | |
| Weighted Avg | 5.35 |
9. Percent of Tunes with Unique Patterns
For a group of tunes, the number of tunes with unique two-note patterns divided by the total number of tunes, expressed as a percent. This metric differs from the previous metric in that it adjusts for the fact that some tunes have more than one unique two-note pattern. The value of this metric can therefore never be greater than the value of the previous metric.
Example: Because Hot Cross Buns has no unique patterns, the value of this metric is also zero. If Hot Cross Buns had a unique pattern, the value of this metric would be 100 percent.
10. Range of Pitches
The difference between the lowest and highest notes–the range of the melody–in a given tune.
Example: The lowest note in Hot Cross Buns is a G (MIDI value of 67) and the highest note is a B (MIDI value of 71. Therefore the Range of Pitches metric has a value of 71 – 67 = 4.
11. Note Duration Ratio
The average length of the duration ratios in a given tune.
Example: Here is a table of duration ratios for Hot Cross Buns along with how many times each of them appears Hot Cross Buns has an average duration ratio of 1.2. By way of comparison, a tune with all quarter notes would have a duration ratio of 1 (because the duration of each note is the same as the previous note and all duration ratios would be “1”).
Table 2 — Average Duration Ratios in Hot Cross Buns Example
| Duration Ratio, | Frequency (#) | Product |
|---|---|---|
| 1 | 10 | 10 |
| 2 | 4 | 8 |
| 0.5 | 1 | 0.5 |
| 0.25 | 1 | 0.25 |
| Sum | 16 | 18.75 |
| Wtd Average | 1.2 |
12. Runs Per Note
The number of runs in a tune divided by the number of notes in that tune.
Example: There are five runs in Hot Cross Buns above and 17 notes total, so the Runs Per Note = 5/17 = 0.294. Here’s how to count the number of runs in the example: The first three notes form a run, as does the G half note to the B quarter note (a run of 1). The second measure forms another run (we’re up to 3 so far). Then we hit a series of G 8th notes, which do not count for or against a run. That means the third measure to the beginning of the fourth measure counts as one run. Finally, the fourth measure contains its own run. That’s five runs in all. Another way to think of the number of runs is to count times the notes change from going up to going down or vice versa and adding one (to account for the first run). Hot Cross Buns changes direction four times: from the G half note to the B quarter note in the first measure; from the B quarter note to the A quarter note in the second measure; from the G 8th note to the A 8th note in the third measure; and from the B quarter note to the A quarter note in the fourth measure.
13. Average Run Length
The simple average of the run lengths of all the runs in a given tune.
Example: The first measure of Hot Cross Buns has a run length of two. In general, in a run of “n” notes, the length of the run is “n-1”. Notes that are of the same pitch value such as the G half note and the G 8th notes in the third measure, count as if they were all one G note. So the run from the G half note in the second measure to the B quarter note in the fourth measure counts as a run length of two. Here are the run lengths of each of the runs in Hot Cross Buns, in order: 2, 1, 2, 2, 2. The average run length is therefore 9/5, or 1.8.
14. Maximum Run Length
The longest run length in a tune.
Example: As noted above, the run lengths in order in Hot Cross Buns are 2, 1, 2, 2, 2. Therefore, the longest run length is two.
15. Repetitive Note Durations
The number of times two consecutive notes have the same duration in a given tune, expressed as a percent of the number of notes in that tune. An example is two consecutive quarter notes, whether or not their pitches are the same. Another way of assigning value to this metric is to count the number of times the duration ratio has a value of “1” in a tune.
Example: This metric has a value of 59% for this metric. Hot Cross Buns has 10 two-note pairs where the second note has the same duration as the first note:
1 — The first two quarter notes
2 — The two quarter notes in the second measure
3 – 9 — The dotted 8th notes
10 — The two quarter notes in the last measure.
Dividing 10/17 = 59 percent.
16. Repetitive Note Pitches
The number of times that two consecutive notes have the same pitch, regardless of the length of either note, expressed as a percent of the number of notes in that tune.
Example: For Hot Cross Buns, this metric has a value of 41%. There are 7 pairs of notes where the second note has the same MIDI value (pitch) as the first note: The half note G in the second measure followed by the first 8th note G in the third measure; three pairs of G 8th notes, and three pairs of A 8th notes. 7/17 = 41%.
17. Spread of Two-Note Pattern Frequencies, Weighted
Standard deviation of the frequency (as a percent of all frequencies in the database) of two-note patterns weighted by the number of occurrences of each two-note pattern in a particular tune. Measures whether the tune tend to use a wide variety of common and uncommon two-note patterns versus a small variety.
Example: For Hot Cross Buns, this metric is 3.8. Table 1 above displays the two-note patterns in Hot Cross Buns and their respective frequencies in the Skiptune database as a whole. This metric is calculated by figuring out the standard deviation of those frequencies, weighted by the number of times they appear in Hot Cross Buns, as shown in the following table:
Table 3 — Standard Deviation Calculation of 2-Note Patt Frequencies in Hot Cross Buns
| Pattern | Freq | Freq – Avg | Square of (Freq – Avg) | Weight | Product | |
|---|---|---|---|---|---|---|
| [2,1] | 10.9 | 5.6 | 30.8 | 3 | 92.4 | |
| [2,2] | 1.8 | -3.6 | 12.6 | 3 | 37.8 | |
| [4,0.5] | 0.3 | -5.1 | 25.5 | 1 | 25.5 | |
| [0,0.25] | 0.2 | -5.2 | 26.5 | 1 | 26.5 | |
| [0,1] | 6.0 | 0.7 | 0.4 | 6 | 2.5 | |
| [2,1] | 9.3 | 4.0 | 15.6 | 1 | 15.6 | |
| [2,2] | 1.7 | -3.7 | 13.3 | 1 | 13.3 | |
| Wtd Avg | 5.35 | |||||
| n | 16 | |||||
| Sum | 214 | |||||
| Std Dev | Square root of 117/6–> | 3.8 |
To keep the site readable to most people, we don’t display equations. Instead, we will walk you through the standard deviation calculation for this metric using Table 3. the “Pattern” and “Freq” column merely duplicate those of Table 1. “Freq – Avg” is the difference between each frequency in Hot Cross Buns and the weighted average of those frequencies, calculated in Table 1 to be 5.35. The “Square of (Freq – Avg)” is the square of the previous column, and all the entries are now positive. The “Weight” column is the number of times each frequency occurs in Hot Cross buns, and the “Product” column is the result of multiplying the previous two columns together. At the bottom of Table 3, we see that the sum of the “Product” column is 214. We divide 214 by 15 to get 14.3, and take the square root of that to get 3.8. We use 15 instead of 16 because we are taking the standard deviation for a sample, not the whole population of all tunes, and the formula requires us to subtract 1 from the total number of data points (n = 16) before doing that division.
18. Spread of Two-Note Pattern Frequencies, Unweighted
Standard deviation of the frequency (as a percent of all frequencies in the database) of two-note patterns in a particular tune where duplicate patterns are ignored. This metric is a counterpart to the weighted metric and differs from it only in that the patterns are unweighted.
Example: This metric has a value of 4.4 for Hot Cross Buns. The only change we make in Table 3 is to replace the weights by “1”, but doing so changes some other numbers that depend on the weights. See Table 4 for the calculation.
Table 4 — Unweighted Standard Deviation Calculation of 2-Note Pattern Frequencies in Hot Cross Buns
| Pattern | Freq | Freq – Avg | Square of (Freq – Avg) | Weight | Product | |
|---|---|---|---|---|---|---|
| [2,1] | 10.9 | 6.6 | 43.4 | 1 | 43.4 | |
| [2,2] | 1.8 | -2.5 | 6.3 | 1 | 6.3 | |
| [4,0.5] | 0.3 | -4.0 | 16.1 | 1 | 16.1 | |
| [0,0.25] | 0.2 | -4.1 | 16.9 | 1 | 16.9 | |
| [0,1] | 6.0 | 1.7 | 2.8 | 1 | 2.8 | |
| [2,1] | 9.3 | 5.0 | 24.9 | 1 | 24.9 | |
| [2,2] | 1.7 | -2.6 | 6.8 | 1 | 6.8 | |
| Wtd Avg | 4.31 | |||||
| n | 7 | |||||
| Sum | 117 | |||||
| Std Dev | Square root of 117/6–> | 4.4 | ||||
The logic to follow this calculation is the same as that for Table 3. Instead of repeating the walkthrough, let’s see if the result makes sense. The metric for unweighted two-pattern frequencies is 4.4, larger than the weighted value of 3.8 for the previous metric. Because 4.4 is larger than 3.8, that means the unweighted two-pattern frequencies are more spread out than when we include each pattern in the calculation every time it appears in the tune. That makes sense because the most repeated pattern, [0, 1], occurs twice as much as any other pattern, and its frequency in the entire database (6%) happens to lie close to the mean (5.35) in Table 3. So when you include [0, 1] all six times it occurs in the tune, it clusters those six data points around the mean, thereby reducing the standard deviation.
19. Pick-up Duration
The duration of a pick-up note(s), if any. If there’s no pick-up note(s), the value is zero.
Example: Hot Cross Buns has no pick-up notes at the beginning, so the value of this metric is zero for our example. But to illustrate this metric, let’s say we inserted an 8th note before the tune (the pitch is irrelevant for pick-up duration) . The value of an 8th note is “2”, so this metric would have a value of “2”.
20. Pick-up Percent
The duration of a pick-up note(s), if any, divided by the duration of the first measure, expressed as a percent. If there is no pick-up note(s), the value is zero.
Example: Like the previous metric, this metric has a value of zero for Hot Cross Buns because there are no pick-up notes. Assuming again an 8th note is inserted before the tune as a pick-up note, this metric would have a value of 2/16 = 0.133 because the value of the pick-up note is “2” and the value of the first measure is 16 (4 quarter notes per measure times a value of 4 for each quarter note).
21. Going to Rests
For a given tune, the average of all the duration ratios of the tune’s rests and their respective preceding notes.
Example: Hot Cross Buns has no rests, so this metric is zero for that tune. If we replaced the first note of each measure with a rest, this metric would have a value of 0.92 (the average of duration ratios 0.5, 0.25, and 2). Note that we don’t include the first rest in this metric because there’s no preceding note (the rest would be the first “note” of the tune).
22. Coming from Rests
For a given tune, the average of all the duration ratios of the tune’s rests and their respective following notes.
Example: Hot Cross Buns has no rests, so this metric is zero for that tune. If we replaced the first note of each measure with a rest, this metric would have a value of 1 (the average of 1, 1, 1, and 1). Note that we include all the rests in this metric because each one is followed by another note.
23. Number of Different Pitches
The number of different MIDI values in a tune, excluding rests. Counts the number of pitches used to construct the tune.
Example: For the simple children’s song, Hot Cross Buns, this metric has a value of three because the tune is constructed entirely of a mere three notes: G, A, and B.
24. Number of Different Intervals
The number of different (duplicates not counted) pitch differentials of one note followed by another. Counts the number of different changes from one pitch to another in the construction of a tune.
Example: For Hot Cross Buns, this metric has a value of four because there are four different pitch differentials in the tune: -2, +4, 0, and +2. Example pitch changes of each, respectively, are B to A (-2), G to B (+4), G to G (0), and A to B (+2). Note that we don’t consider duration values in calculating this metric.
25. Number of Different Durations
The number of different durations of individual notes (tied notes are added together to create a duration) used to construct a tune.
Example: The value of this metric for Hot Cross Buns is 3. There are only three different kinds of durations used in the tune: quarter notes, half notes, and eighth notes.
26. Number of Different Duration Ratios
The number of different duration ratios in a tune.
Example: This metric has a value of 4 for Hot Cross Buns. There are four different duration ratios in the tune: 1, 2, 0.5, and 0.25. Respective examples of pairs of notes with those duration ratios are the B to A quarter notes in the first measure (1), the quarter note A to the half note G in the first measure (2), the half note G to the quarter note B at the end of the first measure to the beginning of the second measure (0.5), and the half note G to the eighth note G from the end of the second measure to the beginning of the third measure.
27. Normalized Number of Different Pitches
The number of different pitches (MIDI values) in a tune divided by the number of notes in that tune, expressed as a percent.
Example: As noted in the “Number of Different Pitches” metric, Hot Cross Buns has three different pitches. There are 17 notes in the tune, so the value for this metric is 3/17 = 18 percent
28. Normalized Number of Pitch Differentials
The number of different pitch differentials (see metric “Number of Different Pitch Differentials”) in a tune divided by the number of notes in that tune, expressed as a percent.
Example: From the “Number of Different Pitch Differentials” metric above, we know that there are four different pitch differentials. For the 17-note Hot Cross Buns, therefore, this metric has a value of 4/17 = 24 percent.
29. Normalized Number of Durations
The number of different durations in a tune (see metric “Number of Different Durations”) divided by the number of notes in that tune, expressed as a percent.
Example: From the “Number of Different Durations” metric above, we know there are three different durations in Hot Cross Buns. Because there are 17 notes, this metric is 3/17 = 18 percent.
30. Normalized Number of Duration Ratios
The number of different durations ratios (see metric “Number of Different Duration Ratios”) in a tune divided by the number of notes in that tune, expressed as a percent.
Example: From a previous metric, we know that the number of different duration ratios in Hot Cross buns is 4, so this metric has a value of 4/17 = 24 percent.
31. Percent of Repeated Pitch Differentials
The number of times that an interval repeats in a tune (consecutively), expressed as a percent of the notes in that tune. Durations and duration ratios are ignored.
Example: From the Hot Cross Buns figure at the top, we see that there are eight instances where a pitch differential is followed by the exact same pitch differential. In order, they are B to A and A to G (both a minor second interval downwards) in the first measure, B to A and A to G in the second measure, the five G notes in a row (for a total of three instances of repeats), four A notes in a row (for a total of two instances of repeats), and one more B to A and A to G in the last measure. If we were to write out just the pitch differentials (intervals) in MIDI notation for this tune, we would get -2 -2 4 -2 -2 0 0 0 0 2 0 0 0 2 -2 -2. That’s 1 + 1 + 3 + 2 + 1 = 8 instances where an interval is repeated consecutively in the tune. There are 17 notes in our example, so the metric is 8/17 or 47%.
32. Percent of Repeated Duration Ratios
The number of times that a duration ratio repeats in a tune (consecutively), expressed as a percent of the notes in that tune. Intervals are ignored.
Example: Hot Cross Buns has six instances where a duration ratio repeats itself consecutively. All the instances occur during the eighth notes in the third measure. Other than that measure, there are no instances where a note is followed by two notes of the same duration. Writing out the duration ratios of Hot Cross Buns, we get 1 2 0.5 1 2 0.5 0.25 1 1 1 1 1 1 1 2 1 2. We can easily count that a duration ratio is followed by the same duration ratio six times in that series. There are 17 notes in Hot Cross Buns, so the metric is 6/17 or 35%.
33. Percent of Palindromes
The number of instances of a 3-note, non-trivial palindrome, expressed as a percent of the notes in the tune.
Example: A musical palindrome, as defined here, is three consecutive notes which read the same forward as backward, excluding the trivial example of three consecutive notes each having the same duration and pitch. Hot Cross Buns has four trivial palindromes, all in the third measure, but no non-trivial palindromes. An example of a non-trivial, 3-note palindrome is a G quarter note followed by an A half note followed by a G quarter note. This metric essentially measures the extent of a specific kind of symmetry in a tune. We exclude trivial palindromes because they are measured by the percent of repeated pitches and repeated durations in a tune (the previous two metrics).
34. Percent Tunes with the Same Individual Patterns
The average percent of tunes that have each of the two-note patterns as the tune in question, taken individually. To be clear: the percent of database tunes that contain the first two-note pattern of the tune in question is calculated, then repeated for the second, third, etc. patterns in the tune in question. Those percents are averaged together to produce this metric, which can be thought of as a counterpart to the “Use of Common Patterns” metric above. The difference is that the “Percent Tunes with the same Individual Patterns” metric measures pattern use as a percent of tunes in the database, where the “Use of Common Patterns” metric measures pattern use as a percent of all patterns in the database.
Example: As we have established, Hot Cross Buns has seven two-note patterns (see Table 1). By comparing each of these patterns with the patterns in every tune in the Skiptune database, we have determined that 61 percent of all the tunes have at least one of each of the patterns in Hot Cross Buns when averaged one at a time.