Intervals Not Distributed Symmetrically
Perhaps the most surprising finding about the intervals in the database is that they are not distributed symmetrically. We examine this feature using four different methods of counting intervals. Those methods of counting are as follows:
- Count how many of each kind of interval are in all the 2-note patterns.
- Count how many tunes contain any one interval.
- Count the different intervals in each tune, but do not count duplicate intervals.
- Count the different intervals in each tune, including duplicate intervals.
Counting Intervals in 2-Note Patterns
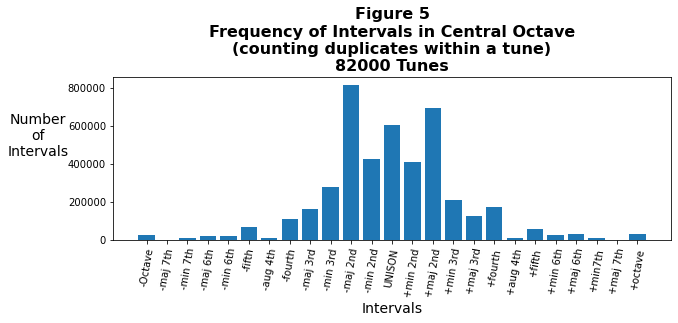
Figure 1 below plots as a histogram the frequencies, or tallies, of the intervals in each identified pattern in the database. This tally counts the number of two-note patterns (of the total 4,651 two-note patterns) for each different interval in the 82,000 tune database (updated January 2026). For example, there are 215 two-note patterns containing a unison interval, that is, an interval where the pitch does not change from the first note to the second. Looking for the “zero” on the horizontal axis in Figure 1 and moving up, you can see the center bar around the 200-mark on the vertical axis (number of patterns).
The asymmetries in Figure 1 are many, but let’s start with the fact that the highest column on the far-left side of the figure is taller than that on the far-right. These two columns indicate the frequency of rests (-42 indicates going to a rest, and +42 indicates coming from a rest). That the left column is far higher than the right column means that the composers use a much wider variety of two-note patterns when a rest follows a note than the variety of patterns of rests followed by notes.
This asymmetry is not true for all intervals. Indeed, it is the opposite for, say, perfect fourths, for which the MIDI values are -5 and +5. Find the bar between “4” and “6” on either side and compare their heights. The frequency for the perfect fourth interval going downward (-5) is lower than that for the fourth interval going upward (+5). Upward perfect fourth patterns have a larger number of durations than downward perfect fourth patterns.
Table 1 below focuses on the central octave of Figure 1 and tallies the frequencies of intervals for two-note patterns within that octave. The “D” and “U” in the bottom row of Table 1 designate Down and Up in pitch for each interval. The table shows that it is primarily major 2nds in which the interval goes down in pitch than up in pitch, followed by minor 7ths. Major 2nds and major 3rds show a light favoritism for more down pitches than up pitches. There are nine intervals (the minor second, minor third, fourth, augmented fourth, fifth, major and minor sixths, major sevenths, and the octave) where the opposite is true: There are more patterns going up than down in pitch for these intervals.
The augmented fourth used to be known as the Devil’s Interval because it was displeasing to ears 500 years ago, so much so that during the Renaissance musicians completely avoided it. As more and more dissonance was tolerated over the centuries, composers increasingly began using this interval, especially in jazz and Broadway musicals. While still rare, rarer still is the major 7th.
| min2 | Maj2 | min3 | Maj3 | 4th | aug4 | 5th | min6 | Maj6 | min7 | Maj7 | Octave | |
|---|---|---|---|---|---|---|---|---|---|---|---|---|
| Upward Frequency | 201 | 213 | 172 | 138 | 177 | 71 | 144 | 97 | 100 | 75 | 48 | 101 |
| Downward Frequency | 192 | 218 | 162 | 142 | 141 | 59 | 124 | 70 | 84 | 82 | 46 | 80 |
| More Up or Down? | U | D | U | D | U | U | U | U | U | D | U | U |
Observe that two of the first four intervals are marked with a “D”. These are the shortest intervals, and while there is one exception (minor sevenths), most of the longer intervals are in two-note patterns going up in pitch. One may tentatively conclude from this that composers tend to move downward in pitch using small intervals, but jump up using larger intervals. That’s because smaller intervals are used more frequently than larger intervals, and there are a lot more patterns using major seconds and thirds than minor sevenths.
However, broadening this analysis to include the entire 3-1/2 octaves we have data for, we find that this grouping does not hold for the other octaves. In fact, overall there are more “Up” intervals than “Down” intervals. Adding up the intervals moving up in the comprehensive interval table, we see that 2,247 intervals moving up in pitch and 2,189 moving down in pitch for the whole database. (As a check on our math, there are 215 intervals where the pitch does not change; 2247 + 2189 + 215 = 4651, which exactly matches our total number of intervals as you can see in the title of Figure 1 above.)
That analysis was for intervals including rests. While the numbers change a bit, there are more “Up” than “Down” intervals even if rests are excluded.
Counting Intervals by Tune
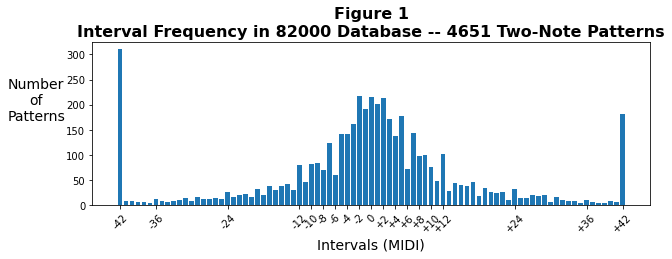
Another way to tally intervals is by looking at how many tunes contain each interval. Figure 2 below shows the frequency of tunes that correspond with their respective intervals on the horizontal axis. The most obvious difference between Figure 1 and Figure 2 is the spread across the horizontal axis. Counting the percent of tunes including each interval (Figure 2) shows that the intervals are more concentrated in the central part of the graph than in Figure 1. This method counts intervals as many times as they appear in a tune. We also observe that the frequency of rests on either side of Figure 2 are comparable to each other, whereas in Figure 1 there were far more patterns going to a rest than coming from a rest. This means that while the composer’s palette of note pairs includes a wider variety of rest duration values, as a practical matter composers tend to use common “go-to” rest patterns.
(NOTE to jazz musicians: the “-” and “+” signs on the horizontal axis indicate decreasing and increasing intervals, respectively; the symbols “-” and “+” on this site do not refer to minor and augmented chords.)
Counting Intervals Once Per Tune
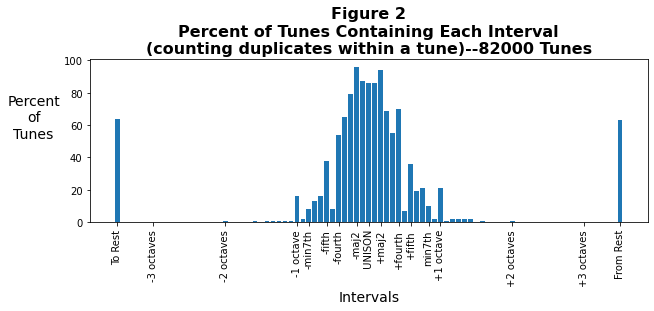
More useful may be to count the number of intervals once no matter how many times it occurs in a tune. That is, we count a two-note pattern one time per tune no matter how many times it repeats in that tune. This manner of counting is the same as calculating the percent of tunes in which a particular interval can be found. Thus, Figure 2 (above) and Figure 3 (below) are directly comparable even though they plot in different units.
In general, Figures 2 and 3 have more in common with each other than either does with Figure 1. Both Figure 2 and 3 are more concentrated in the central part of the graph than Figure 1, and the frequencies of the two intervals involving “rests” on either side of the chart are essentially equal. Both also confirm the common sense notion that composers rarely reach outside an octave when moving note to note. For those reasons, both of these methods of counting intervals seems to be more useful than the method shown in Figure 1.
While you can’t see this just looking at Figure 3, the number of intervals going down in pitch is more than those going up in pitch when counting intervals by this method. We find 848,024 intervals going down and 827,112 going up, including rests. Even if you exclude rests as a special case (because they’re not really intervals), this relationship holds.
Focusing on the Central Octave
The empty space in Figure 3 squeezes the data toward the center, so we re-plot just the central two octaves of Figure 3 and present the results in Figure 4 below. We plot the frequencies rather than the percents on the vertical axis so we can examine individual pairs of intervals that mirror each other by going either up or down in pitch.
The distribution is roughly symmetrical for minor seconds but there are clearly more major second intervals moving down in pitch than up in Figure 4. The difference is also pronounced for minor thirds, and the asymmetry continues for major thirds. In general, composers tend to use shorter intervals (2nds and 3rds) when moving the melody downward in pitch rather than larger intervals.
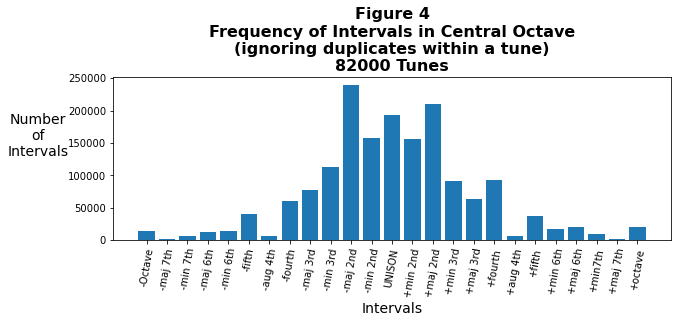
When we get to perfect fourth intervals, the asymmetry reverses, where there are 60,435 perfect fourth descending intervals but 92,490 ascending perfect fourth intervals. That works out to only 40 percent of the perfect fourth intervals move down in pitch while 60 percent move up, a huge difference of 20 percentage points and the largest percentage difference we found by far for any pair of intervals around unison. As an aside, these percentages have not budged in years as we’ve added tens of thousands of new tunes, and therefore appear to be a stable feature of music.
We conclude that composers tend to use shorter intervals, especially major 2nds, when going down in pitch, but when their melodies need to take a turn upward, they tend to use perfect fourths. Perfect fifth intervals are roughly equal in frequency with respect to their pitch direction. All the remaining intervals, minor sixths to a full octave, also have more upward intervals than downward, but they are swamped by the use of the perfect fourth to jump up in pitch.
This is not to say composers don’t use major seconds when their melody goes up in pitch, for the +major 2nd bar in Figure 4 is tall, but they sprinkle in a healthy mix of perfect fourths.
Counting Intervals Every Time They Occur
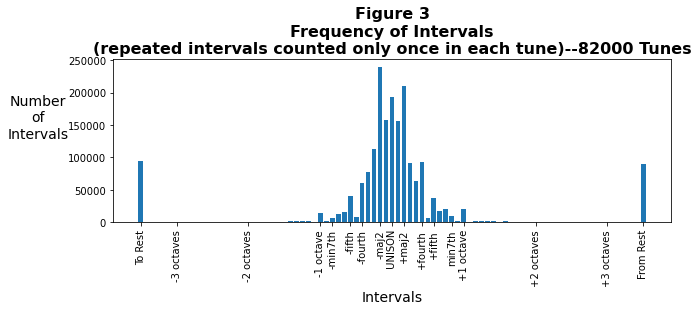
Our fourth way of counting intervals is simply to count them each and every time they occur in a tune. That means if a major second interval appears twice in a tune, it gets counted twice. The results are plotted below in Figure 5 for the two octaves around unison. Figure 5 is rather similar to Figure 4 and the overall asymmetry remains close, but Figure 5 is even more clustered around the center. Note that counting intervals every time they occur results in a vertical axis with much higher values. Moving from either direction of the center bar we see that the relative heights of the columns are close for both figures 4 and 5. Note that the relative heights of the minor second columns are slightly between Figures 4 and 5, but the difference is small.
Most importantly, Figure 5 is consistent with Figure 4 in suggesting that composers tend to write melodies going down in pitch using smaller intervals and jump up with perfect fourths when they need to. While neither the +fourth nor the -fourth bars are particularly tall, their relative difference is the largest in the chart: 39 percent of fourth intervals go down, while 61 percent go up. Note that this is the same ratio as in Figure 4 when duplicate intervals within a tune are only counted once. It would seem that within a given tune composers repeatedly use seconds, thirds, and fifths to move the melody downward in pitch, and fourths, sixths, sevenths and octaves to move the melody upward in pitch, and that his tendency holds no matter how you tally the data.
To see a table of all the intervals in the database and their respective frequencies, go to the interval page.